Biomed Res Bull. 1(2):60-65.
doi: 10.34172/biomedrb.2023.12
Original Article
Evaluation of the Effect of TNF-α on the Expression of G-CSF and M-CSF in the Monocytes of Multiple Sclerosis Patients
Mohadeseh Rajabpour 1  , Poya Vakili 1, Sona Abolhasani 2, *
Author information:
1Immunology Research Center, Tabriz University of Medical Sciences, Tabriz, Iran
2Department of Neurology, Tabriz University of Medical Sciences, Tabriz, Iran
Abstract
Background:
Multiple sclerosis (MS) is an inflammatory autoimmune disease in which the myelin sheaths of nerve cells in the brain and spinal cord are damaged. This damage can disrupt the abilities of parts of the nervous system that are responsible for communication and cause many physical signs and symptoms. Granulocyte colony-stimulating factor (G-CSF) is a major extracellular regulator of hematopoiesis and the innate immune system. Macrophage colony-stimulating factor (M-CSF) is a glycoprotein that is effective in hematopoiesis and stimulates the production of numerous cytokines. It also plays a key role in stimulating the clearance of myelin by the brain’s innate immune cells, which is a prerequisite for proper remyelination and myelin repair. The aim of the study was to investigate the effect of overlapping and non-overlapping cytokines in MS.
Methods:
Overall, 20 MS patients referred to the MS clinic of Imam Reza hospital with mild, moderate, and severe stages were selected for investigation. The blood samples were taken from the patients, and magnetic-activated cell-sorting monocyte cells were separated from peripheral blood mononuclear cells (PBMCs). The purity of the monocyte cells was determined using flow cytometry and the CD14 antibody. The monocyte cells were then cultured and stimulated with tumor necrosis factor (TNF) over a time course of 0, 6, 12, 24, and 48 hours. After the end of stimulation, the cells were collected, and the expression level of G-CSF and M-CSF was evaluated by real-time polymerase chain reaction (RT-PCR).
Results:
The expression of G-CSF and M-CSF receptors decreased significantly over time as a time course of stimulation, with the lowest value 12 hours after stimulation. Comparing G-CSF and M-CSF, the decreasing ratio has been the same. The level of TNF-α function was evaluated as a time course.
Conclusion:
The results of RT-PCR showed that TNF-α significantly decreases the expression of innate immune system receptors such as G-CSF and M-CSF. This reduction was in surface receptors such as G-CSF and M-CSF.
Keywords: TNF-α, G-CSF, M-CSF, Multiple sclerosis
Copyright and License Information
© 2023 The Author(s).
This is an open-access article distributed under the terms of the Creative Commons Attribution License (
http://creativecommons.org/licenses/by/4.0), which permits unrestricted use, distribution, and reproduction in any medium, provided the original work is properly cited.
Introduction
Multiple sclerosis (MS) is a chronic neurodegenerative disease of the central nervous system (CNS), in which a collection of demyelinating lesions occurs in both white and gray matter in the brain and spinal cord.1
It is estimated that approximately three million people are influenced by MS worldwide, and females are more affected than males.2 MS exhibits an autoimmune mechanism where the target is characterized by myelin antigens. Both CD4 + and CD8 + T lymphocytes play a significant role in the pathological mechanism.3 In MS, pathogenic T helper (Th) 17, Th1, and CD8 + auto-reactive T cells are targeted against myelin elements. In addition, regional microglia and macrophages are activated in the demyelinated lesions.2 Moreover, B cells play a role in the immunopathogenesis of MS. In the earlier phases of the disease, CD20 + B cells are the most detected, while in the progressive stage, plasmablasts and plasma cells are mostly involved.3 B cell engagement is not only associated with antibody production but also with antigen presentation to T cells and myeloid cell function alteration due to cytokine production.4
Tumor necrosis factor-α (TNF-α) is a pleiotropic cytokine with a wide range of functions involving homeostatic, immune, and inflammatory effects.5 The pathogenic functions of TNF-α include the triggering of inflammation, proliferation of immune cells, stimulation of vascular endothelium, and tissue damage.5 Under physiological conditions, macrophages, lymphocytes (T and B), natural killer cells, dendritic cells, and monocytes produce TNF-α in the periphery,6 whereas inflammatory stimuli in the CNS provoke TNF-α production mostly by microglia, neurons, astrocytes, and infiltrating immune cells.5 The pleiotropic functions of TNF-α regularly show paradoxical effects, particularly in the CNS. In other words, TNF-α and its receptors can either stimulate neuroinflammation and secondary neuronal destruction or apply protective functions in pathological settings.7 Additionally, TNF-α exerts distinct actions at different phases of autoimmune demyelination.5,7
Granulocyte colony-stimulating factor (G-CSF) is a main regulator of hematopoiesis and the innate immune system that is named for its relatively particular stimulation of the growth of neutrophil progenitor cells in vitro in semi-solid cultures.8 G-CSF affects the survival, proliferation, and differentiation of all cells in the neutrophil lineage, from hematopoietic stem cells to mature neutrophils, and impacts the function of mature neutrophils.8 G-CSF was not predicted to regulate T cell behavior because it was named for its influence on myeloid cells. Further, it has been revealed that resting T cells do not express G-CSF receptors (G-CSFRs), and indeed, G-CSF was not detected to affect T cell numbers in early preclinical and clinical studies. However, investigations demonstrated that exposure to G-CSF in vivo provoked changes in T cell function, including polarization toward a Th2 phenotype (secreting interleukin [IL]-4 and IL-10) rather than the interferon-γ secreting Th1 phenotype and diminished proliferation in response to alloantigens.8,9 Within the CNS, G-CSF is expressed by neurons in all brain regions involving the hippocampus CA3 field, the entorhinal cortex, the olfactory bulb, the hilus and subgranular zone of the dentate gyrus, and several cerebellar and brainstem nuclei where its receptor is expressed.10 G-CSFRs are also expressed in dopaminergic neurons in the adult substantia nigra or mesencephalic cultures.11 In addition to neurons, G-CSF is also discovered in astrocyte cultures after stimulation. Recently, it has been demonstrated that G-CSF administration accomplishes significant immunomodulation in adaptive immunity or neuroprotection after cerebral ischemia and neurodegeneration through different mechanisms.11 Therefore, it has been suggested that G-CSF is a potential new agent for immunomodulation and neuroprotection.11
Macrophage colony-stimulating factor (M-CSF) was discovered to be a glycoprotein that motivated macrophage colony development of mouse bone marrow cells in a semisolid agar culture system. Furthermore, M-CSF stimulates the differentiation of progenitor cells into mature monocytes and elongates the survival of monocytes.12 It increases the expression of differentiation antigens and stimulates the activities of monocytes, including chemotactic, phagocytic, and killing functions, and stimulates the production of numerous cytokines, including granulocyte-macrophage CSF, granulocyte CSF, and IL-6, by preparing monocytes, and directly stimulates the production and secretion of IL-8 and reactive nitrogen intermediates. In addition to stimulating hematopoiesis, M-CSF stimulates the differentiation and proliferation of osteoclast progenitor cells and cytotrophoblasts as well.12 On the other hand, it has been revealed that M-CSF plays a significant role in stimulating myelin clearance by the brain’s innate immune cells, which is essential for proper myelin repair and remyelination processes.13
This study aimed to evaluate the effects of TNF-α administration on the expression of G-CSF and M-CSF in the monocyte cells of MS patients.
Materials and Methods
This study was conducted in the immunology laboratory of the Immunology Research Center and the immunology laboratory of the Medicine Faculty at Tabriz University of Medical Sciences.
Patient Selection
In this case-control study, 20 MS patients with moderate and severe stages were selected from the MS Polyclinic of Imam Reza hospital (which is a referral center) from January until May 2021. We selected all the patients from the 17- to 40-year-old range. We included patients who were under treatment and had more than two years of diagnosis. However, patients who were pregnant, newly diagnosed, vulnerable, or who discontinued treatment for any reason were excluded from the study.
Sample Collection
After getting informed consent, venous blood samples were obtained from the selected patients and transferred to the laboratory of the Immunology Department for further examination.
Cell Culture
To investigate the function of TNF alpha, monocytes in the blood were isolated and cultured by the peripheral blood mononuclear cell (PBMC) method.
For this purpose, first, heparinized blood was diluted with 10 mL of Dulbecco’s Modified Eagle Medium (DMEM) culture medium. Then, it was diluted by slowly adding it to Ficoll, whose volume is equal to undiluted blood, and centrifuged at 800 RPM for 15 minutes. Next, mononuclear cells were collected slowly between Ficoll and diluted blood.
The obtained PBMC was mixed with the DMEM culture medium and centrifuged at 450 RPM for 10 minutes in order to remove the accompanying Ficoll, and again mixed with the DMEM culture medium and centrifuged at 200 RPM for 10 minutes to remove platelets along with the PBMC. The amount of obtained PBMCs was determined using Trypan blue dye.
Several 1 × 10⁷ cells for each flask, along with DMEM culture medium and 2 mM L-glutamine, 100 U/mL penicillin, 100 μg/mL streptomycin, and 10% serum, were added, and one flask was considered a control group.
After 2 hours of incubation at 37 °C with 5% CO2 and 90% humidity, the supernatant containing all mononuclear cells except monocytes was removed by gently washing twice.
Then, 5 mL of cold peripheral blood smear buffer without calcium and magnesium and with 10 mM of EDTA were added to each flask and gently shaken for 10 minutes to separate the cells. Then, the purified cells were examined microscopically, and the time required for cell counting, viability, and the level of expression of CD14, which indicates the purity of monocytes, was investigated using the magnetic-activated cell sorting method. The cells were cultured in the DMEM culture medium and treated with 10 μL of TNF-α for 2, 6, 12, 24, and 48 hours.
Preparation of Buffers
The specified amount of 96% alcohol was added to the washing buffers. Before performing the experiment, 10 μL of 2-mercaptoethanol (2-ME) was added to each milliliter of lysing buffer that was necessary.
Extracting RNA From Blood
For this purpose, blood taken on EDTA is the most effective sample. First, 150 μL of whole blood after mixing was added to 750 μL of lysis buffer. Then, it was shaken well and kept in the laboratory environment for 5 minutes. The microtube was shaken well to mix the ingredients well. Next, the mixture was kept at room temperature for 3 minutes.
After mixture, Centrifuge was done at 13 000 rpm for 12 minutes at 4 °C. Next, three phases were formed, the upper of which contained RNA and was separated.
This solution was mixed with 400 μL of 70% alcohol and shaken well. Then, the solution was added to the silica column and centrifuged at 13000 RPM for 1 minute.
The collector microtube under the column, which contains the waste materials collected after passing through the filter, was discarded.
Subsequently, the silica column was placed on the new collector microtube, and 700 μL of washing buffer was added and centrifuged at 13000 RPM for 1 minute.
After emptying the collector microtube, where the washed liquid was collected again, it was placed under the silica column and centrifuged at 13000 RPM for 2 minutes. After removing it, the silica column was placed on a new 1.5-μL microtube, and 50 μL of previously heated separation buffer was added to it. Then, it was kept in the environment for 3 minutes, and the column was centrifuged for 1 minute.
The quality and quantity of the extracted RNA samples were confirmed by spectrophotometry at 260 and 280 nm wavelengths. DNAase I (Gibco Invitrogen) was added to avoid RNA contamination. For cDNA synthesis, the samples were used if their ODDS ratios (260-280 nm) were between 8.1 and 8.2. The first strand cDNA synthesis kit (Fermentase, Lithuania) was utilized for cDNA synthesis. According to its instructions, 5 μg of RNA, 1 μL of oligo-dT, and 1 μL of random hexamer primer, with a total volume of 12 μL, were added to half-cc-Eppendorf tubes and incubated for 5 minutes at 70 °C and for 5 minutes in dry bulk. Then, they were transferred to ice, and 4 μL of the reaction buffer, 2 μL of 10 mM dNTP, and 1 μL of RNAase inhibitor were added to each tube, which was then incubated for 5 minutes at 37 °C and for 5 minutes at 25 °C. Thereafter, 1 μL of the transcriptase enzyme was added to all the tubes, and the samples were incubated at 42 °C for 90 minutes. Finally, the reverse transcriptase enzyme was deactivated at 70 °C for 10 minutes, and the cDNA was kept at 75 °C until the next tests.
Real-time Polymerase Chain Reaction
All real-time polymerase chain reactions (RT-PCRs) were performed using a Rotor GeneTM 6000 (Corbett) machine. The timer program of the device was set in three stages. The first step leads to the denaturation of cDNA molecules (95 °C for 5 minutes), the second step of 95 °C for 10 seconds for denaturation, 56 °C for 10 seconds for annealing, and 60 °C for 24 seconds for extension were performed in 40 consecutive cycles, and in the final stage, to draw the melting curve, the temperature was increased by 1 °C every 5 seconds from 50 °C to 99 °C. These reactions were performed in 0.1 mL microtubes with a final volume of 10 μL. The ingredients of each reaction included 5 μL of 2X QuantiFast SYBR Green PCR Master Mix and 0.5 μL of each of the reverse primers with a concentration of 10 pM, 2 μL of water lacking RNase, and 2 μL of the template cDNA.
To draw the standard curve, one of the control cDNAs with the appropriate concentration was selected, and then 51-55 consecutive dilutions of it were used.
The standard curve was drawn based on the logarithm of cDNA concentration on the horizontal axis and the threshold cycle on the vertical axis for each gene. The PCR efficiency was determined based on the standard curve for each gene. An amplification curve (Curve amplification) was drawn for each RT-PCR from the sample without cDNA (Control Template No. NTC) as a negative control.
Enzyme-Linked Immunosorbent Assay
To check and confirm the level of inflammation, the IL-6 ELISA kit purchased from Abcam was used, and the work steps were performed according to the protocol in the kit. Cell supernatant was utilized for this.
Statistical Analysis
A one-way ANOVA test was employed to statistically compare gene expression using GraphPad Prism 7 software. A P value was used for all relationships, and P < 0.05 was considered statistically significant.
Results
G-CSF expression increased significantly at the determined times for TNF-α treatment, 12 hours after treatment (P < 0.0001). Compared to other times, the time of 6 hours also increased, but it was not significant (Figure 1).
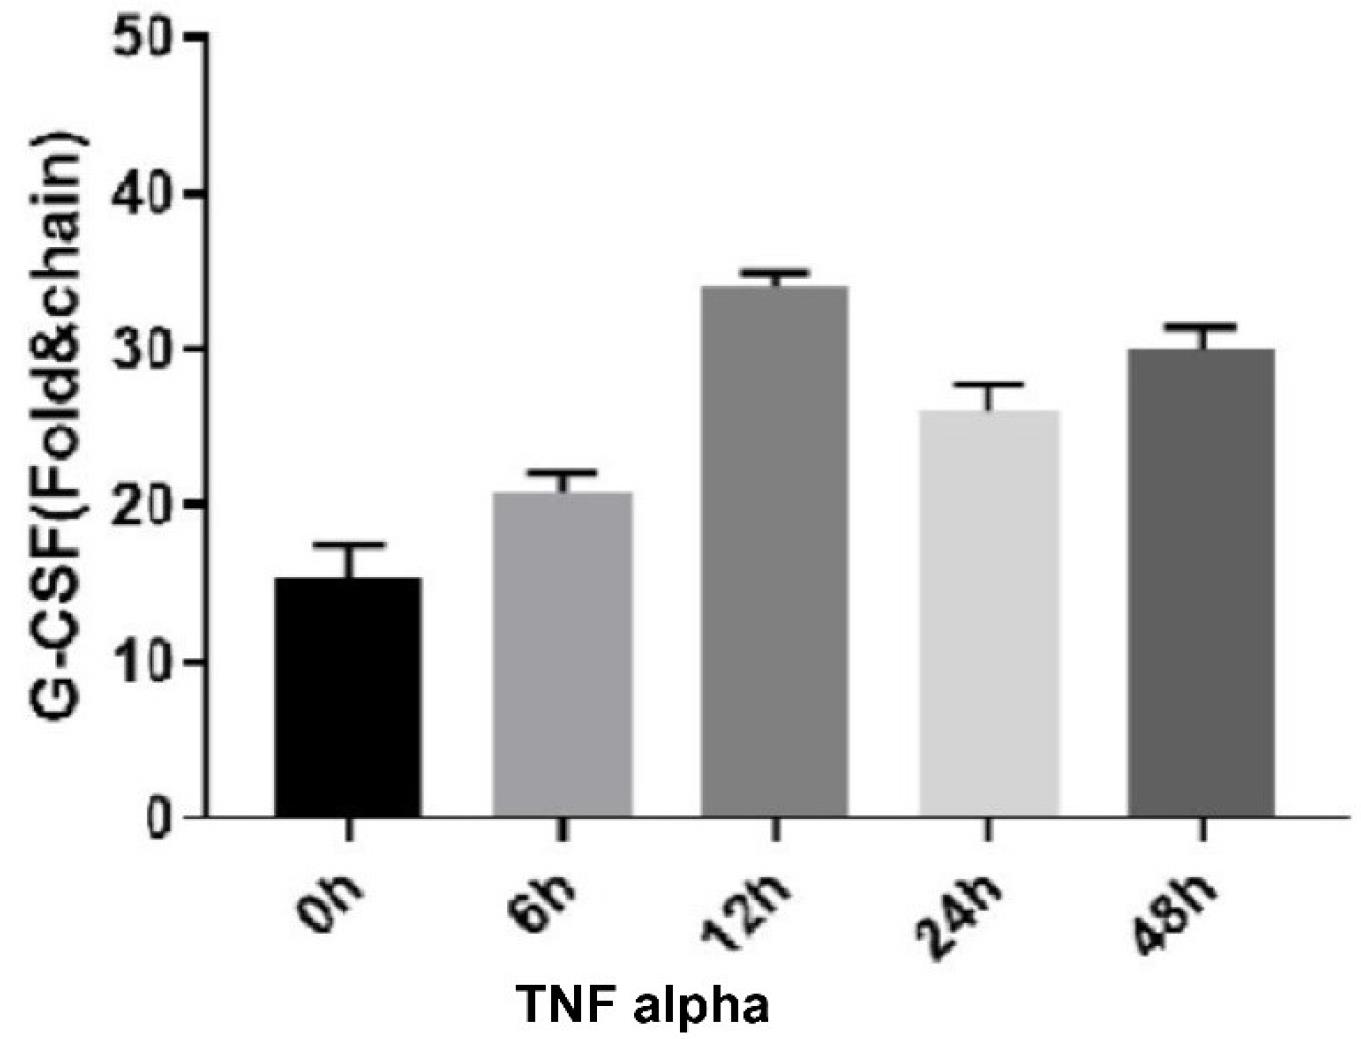
Figure 1.
TNF Alpha Effect on G-CSF Expression. Note. TNF: Tumor necrosis factor; G-CSF: Granulocyte colony-stimulating factor
.
TNF Alpha Effect on G-CSF Expression. Note. TNF: Tumor necrosis factor; G-CSF: Granulocyte colony-stimulating factor
In addition, M-CSF expression increased significantly at the determined times for TNF-α treatment, 12 hours after treatment (P < 0.0001, Figure 2).
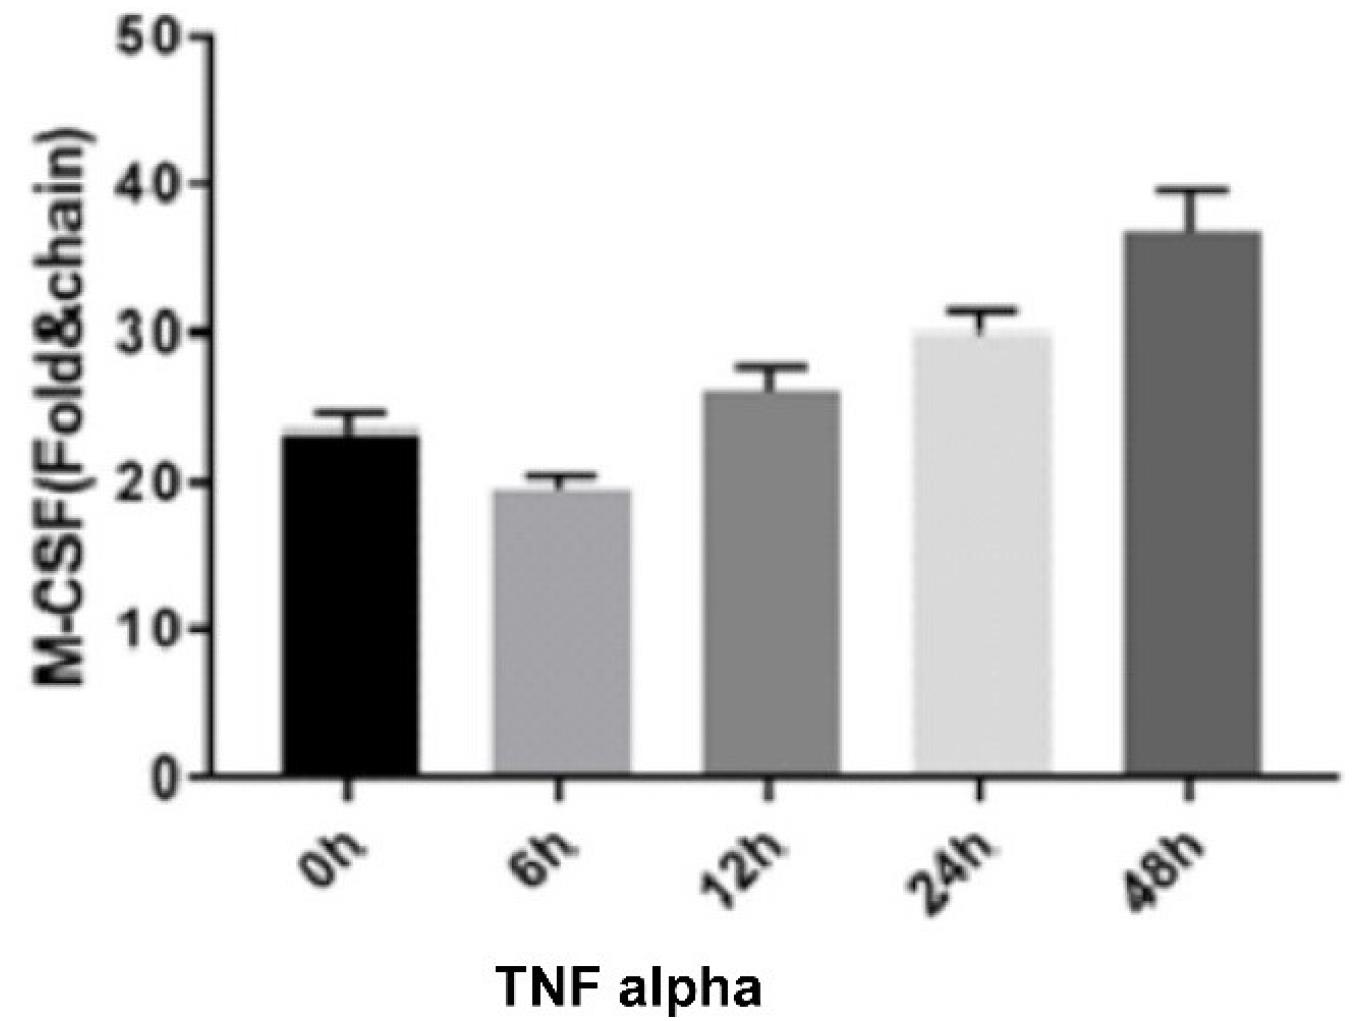
Figure 2.
TNF Alpha Effect on M-CSF Expression. Note. TNF: Tumor necrosis factor; M-CSF: Macrophage colony-stimulating factor
.
TNF Alpha Effect on M-CSF Expression. Note. TNF: Tumor necrosis factor; M-CSF: Macrophage colony-stimulating factor
The ELISA results showed that the level of IL-6 expression increased significantly at the designated TNF-α-treatment times of 24 and 48 hours (P < 0.0001). These results revealed that the amount of inflammation increased significantly at 24 and 48 hours after treatment (Figure 3).
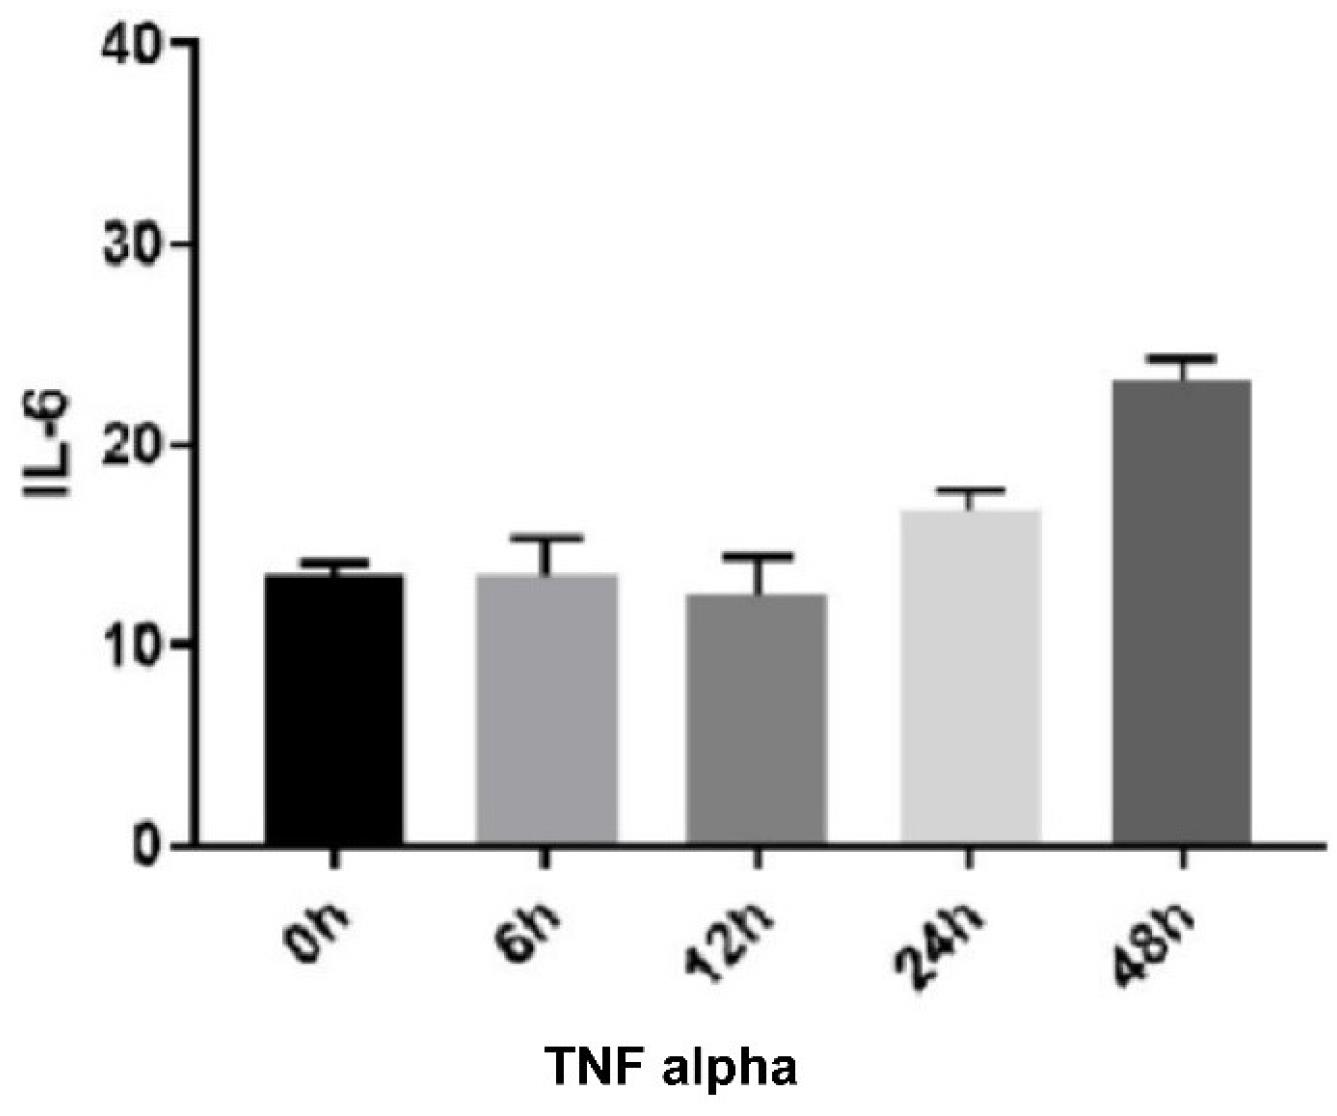
Figure 3.
TNF Alpha Effect on IL-6 Expression. Note. IL: Interleukin
.
TNF Alpha Effect on IL-6 Expression. Note. IL: Interleukin
Discussion
According to the global pattern of increasing prevalence and incidence of MS, even in the traditionally low-prevalence regions of the world, concerns about MS are increasing. In addition, the exact cause of MS is unknown, and usually, a multifactorial cause is expected where both genetic and environmental factors influence an individual’s disease risk in a complicated interaction that is not completely understood.14,15 Due to a lack of understanding of the pathogenic mechanisms underlying MS, current therapeutic options remain somewhat disappointing and challenging.16 However, most researchers regard MS as a primary inflammatory disease in which demyelination and tissue damage are mediated by immune-mediated processes at all stages and in all courses.3
MS exhibits an autoimmune mechanism where the target is characterized by myelin antigens, in which both CD4 + and CD8 + T lymphocytes play a significant role in the pathological process.1 Moreover, pathogenic Th17, Th1, and CD8 + autoreactive T cells are targeted against myelin components. In the demyelinated lesions, regional microglia and macrophages are activated as well.1,2 Additionally, B cells play a role in the immunopathogenesis of MS.1 CD20 + B cells are the most abundant in the early stages of the disease; however, plasma cells and plasmablasts are the most active in the later stages.1,3 B cell participation is linked not only to antibody production but also to antigen presentation to T cells and changes in myeloid cell function as a result of cytokine secretion.4
As a result of immune-mediated myelin loss and axonal injury, patients experience a wide range of clinical symptoms, including visual blurring or loss, brainstem syndromes such as double vision and internuclear ophthalmoplegia, facial weakness, vertigo, dysphagia, dysarthria, and tongue weakness, sensory and motor impairments, bladder and bowel dysfunction, depression, fatigue, and levels of cognitive impairment.17
The greatest unmet requirements in MS are treatments that postpone, prevent, or reverse progression. One of the most suggestible strategies to attain this is to therapeutically improve endogenous remyelination, resulting in reestablishing nerve conduction and avoiding neurodegeneration.18
Remyelination is the process by which new myelin sheaths are restored to demyelinated axons, enabling them to regain the ability to carry action potentials by saltatory conduction and to recover lost function.19 Although pre-existing mature oligodendrocytes can enhance the number of internodes they produce and thus contribute to recovery after demyelination, they do not enlarge the pool of new myelinogenic oligodendrocytes that are necessary for remyelination.18 Thus, remyelination is remarkably dependent on adult oligodendrocyte progenitor cells (aOPCs), which develop from neonatal OPCs (nOPCs). 20 These cells are maintained in adequate amounts mainly by their own self-renewal rather than by substitution from neural stem cell niches in the CNS.18
Studies on myelination have provided valuable clues about the possible factors that have been shown to be effective in remyelination. Nevertheless, evolutionary studies demonstrate that many signaling molecules, including growth factors, cytokines, chemokines, neurotransmitters, and the extracellular matrix (ECM), possibly play a role in OPCs’ action. The regulators of the differentiation of OPCs into oligodendrocytes include growth factors, the ECM, adhesion molecules, and the Notch-jagged pathway. The mechanisms of intracellular signaling and transcriptional regulation of oligodendrocyte differentiation can provide a basis for pharmaceutical approaches to manipulate this process.18,19
Monocytes are the largest group of blood leukocytes that can differentiate into dendritic cells and macrophages. They play a significant role in remyelination by creating a favorable environment for OPC recruitment and evolution through the phagocytosis of myelin fragments that typically inhibit remyelination, adjustment of the ECM, and excretion of regenerative factors.21
Monocytes are an attractive therapeutic target for neurodegenerative diseases because their exposure to drugs in the peripheral blood eliminates the need for blood-brain barrier permeability and facilitates monitoring of responses to drugs. Although there is currently no medication that precisely targets monocytes for remyelination, current studies have identified significant pathways and drugs.21
Granulocytes and monocytes are derived from common bone marrow progenitor cells, which proliferate and differentiate in semi-solid environments to develop granulocytes, monocytes, or both colony types. The proliferation of these colony-forming cells (CFU-GM) depends on one or more glycoprotein growth factors, which are called CSFs. The four known human CSFs involve IL-3, GM-CSF, G-CSF, and M-CSF.19,22 Studies have shown that CSFs, as well as their hematopoietic properties, have a direct effect on mature myeloid cells.22 G-CSF plays an important role in acquiring immunity by differentiating T cells from Th1 to Th2, inducing the Th2 response, neuroprotection, and tissue repair.11,23 M-CSF also plays a key role in stimulating myelin clearance by innate immune cells, which is essential for proper remyelination and the myelin repair process.13,23 TNF-α has also been found to have several functions, which can be divided into three categories:
-
Anti-tumor function: The induction of hemorrhagic necrosis in subcutaneously implanted tumors through the induction of free radicals in tumor cells and vascular damage
-
Immune modulatory activity and function in the inflammatory response by activating T cells
-
Effects on metabolism: TNF-α causes hypertriglyceridemia and cachexia, which are symptoms of chronic infections and neoplasms. other activities include vascular endothelial cell growth and ischemic tissue damage effects.24,25
Guo et al discovered that TNF-α has an increasing effect on the levels of IL-6 and IL-1 in a study on the effect of TNF-α on immune responses.26 The results of a study by Ishizu et al on G-CSF in MS confirmed that the level of G-CSF was elevated.27 Furthermore, Tsai et al concluded that M-CSF and G-CSF levels were elevated in MS patients,28 which is consistent with our results. In their study on macrophages, inflammatory cytokines, and chemokines, Mia et al revealed that the levels of IL-6 and GM-CSF increased in chronic inflammatory diseases.29
Lee et al focused-on GM-CSF and its effect on fetal microglia cells and showed that the effect of GM-CSF on fetal microglia cells was dose-dependent and synergistic with M-CSF. The production of GM-CSF was investigated in pure human fetal microglial and astrocyte cultures after stimulation with LPS, TNF-α, or IL-1. Unlike M-CSF, none of the cell types produced GM-CSF in unstimulated cultures. However, when stimulated with IL1-β, astrocytes could express GM-CSF mRNA and proteins, which are activated within 72 hours.22
An immunocytochemical study that was performed to identify the in vivo sources of GM-CSF revealed selective marking of active astrocytes in active lesions of MS and Pierre’s plaques of Alzheimer’s disease. The study findings represented that human embryonic and adult microglia can proliferate in response to CSFs, with GM-CSF being a more effective stimulus.22
The results of the study by Tsai et al proposed the presence of the G-CSF receptor and the G-CSF system in the CNS, which has enhanced the possibility that G-CSF should have important non-hematopoietic functions in the CNS.28 In the study of Xiao et al, models experimentally treated with G-CSF showed better functional improvement from 2 weeks to 5 weeks after ischemia compared to the control group. G-CSF given in the sub-acute phase (days 11 to 20) improved not only motor performance but also brain function compared to acute phase treatment (days 1 to 10). G-CSF injection decreased hemispheric atrophy at 35 days after cerebral ischemia and demonstrated a significantly lower level of Evans blue staining compared to cerebral ischemia in only 3 days, indicating the reduction of blood-brain barrier disruption. The administration of G-CSF after transient ischemia also led to a decline in the amount of edematous tissue existing in both structural magnetic resonance imaging and brain water content.11
In the clinical study conducted by Logan et al on cancer patients, endogenous production of G-CSF and M-CSF enhanced the resulting TNF-α injection. The increase of these two cytokines occurred with leukocytosis in patients, showing the possible role of these endogenous cytokines in the discharge of bone marrow cell reserves.25
The findings of previous studies on the increasing effect of TNF-α on G-CSF and M-CSF are in line with those of the current study, with the exception that our study, to the best of our knowledge, is the first to focus on the effects of TNF-α on chemokines in MS disease. In general, it was found that the expression of G-CSF and M-CSF in monocytes extracted from the blood of MS patients increased during TNF-α cytokine treatment, and the number of inflammatory factors in these patients increased as well.
Authors’ Contribution
Conceptualization: Mohadeseh Rajabpour.
Data curation: Mohadeseh Rajabpour.
Formal analysis: Poya Vakili.
Funding acquisitio: Poya Vakili.
Investigation: Poya Vakili.
Methodology: Mohadeseh Rajabpour, Poya Vakili.
Project administration: Sona Abolhasani.
Resources: Sona Abolhasani.
Software: Poya Vakili.
Supervision: Sona Abolhasani.
Validation: Mohadeseh Rajabpour.
Visualization: Mohadeseh Rajabpour.
Writing–original draft: Poya Vakili.
Writing–review & editing: Sona Abolhasani.
Competing Interests
None.
Ethical Approval
The study was approved by Ethics Committees of Tabriz University of Medical Sciences (IR.TBZMED.REC.1402.547).
Funding
None.
References
- Chiricosta L, Blando S, D’Angiolini S, Gugliandolo A, Mazzon E. A comprehensive exploration of the transcriptomic landscape in multiple sclerosis: a systematic review. Int J Mol Sci 2023; 24(2):1448. doi: 10.3390/ijms24021448 [Crossref] [ Google Scholar]
- Baecher-Allan C, Kaskow BJ, Weiner HL. Multiple sclerosis: mechanisms and immunotherapy. Neuron 2018; 97(4):742-68. doi: 10.1016/j.neuron.2018.01.021 [Crossref] [ Google Scholar]
- Lassmann H. Pathogenic mechanisms associated with different clinical courses of multiple sclerosis. Front Immunol 2018; 9:3116. doi: 10.3389/fimmu.2018.03116 [Crossref] [ Google Scholar]
- Gharibi T, Babaloo Z, Hosseini A, Marofi F, Ebrahimi-Kalan A, Jahandideh S. The role of B cells in the immunopathogenesis of multiple sclerosis. Immunology 2020; 160(4):325-35. doi: 10.1111/imm.13198 [Crossref] [ Google Scholar]
- Kemanetzoglou E, Andreadou E. CNS demyelination with TNF-α blockers. Curr Neurol Neurosci Rep 2017; 17(4):36. doi: 10.1007/s11910-017-0742-1 [Crossref] [ Google Scholar]
- Caminero A, Comabella M, Montalban X. Tumor necrosis factor alpha (TNF-α), anti-TNF-α and demyelination revisited: an ongoing story. J Neuroimmunol 2011; 234(1-2):1-6. doi: 10.1016/j.jneuroim.2011.03.004 [Crossref] [ Google Scholar]
- Probert L. TNF and its receptors in the CNS: the essential, the desirable and the deleterious effects. Neuroscience 2015; 302:2-22. doi: 10.1016/j.neuroscience.2015.06.038 [Crossref] [ Google Scholar]
- Roberts AW. G-CSF: a key regulator of neutrophil production, but that’s not all!. Growth Factors 2005; 23(1):33-41. doi: 10.1080/08977190500055836 [Crossref] [ Google Scholar]
- Rossetti M, Gregori S, Roncarolo MG. Granulocyte-colony stimulating factor drives the in vitro differentiation of human dendritic cells that induce anergy in naïve T cells. Eur J Immunol 2010; 40(11):3097-106. doi: 10.1002/eji.201040659 [Crossref] [ Google Scholar]
- Schneider A, Krüger C, Steigleder T, Weber D, Pitzer C, Laage R. The hematopoietic factor G-CSF is a neuronal ligand that counteracts programmed cell death and drives neurogenesis. J Clin Invest 2005; 115(8):2083-98. doi: 10.1172/jci23559 [Crossref] [ Google Scholar]
- Xiao BG, Lu CZ, Link H. Cell biology and clinical promise of G-CSF: immunomodulation and neuroprotection. J Cell Mol Med 2007; 11(6):1272-90. doi: 10.1111/j.1582-4934.2007.00101.x [Crossref] [ Google Scholar]
- Motoyoshi K. Biological activities and clinical application of M-CSF. Int J Hematol 1998; 67(2):109-22. doi: 10.1016/s0925-5710(98)00010-3 [Crossref] [ Google Scholar]
- Laflamme N, Cisbani G, Préfontaine P, Srour Y, Bernier J, St-Pierre MK. mCSF-induced microglial activation prevents myelin loss and promotes its repair in a mouse model of multiple sclerosis. Front Cell Neurosci 2018; 12:178. doi: 10.3389/fncel.2018.00178 [Crossref] [ Google Scholar]
- Lane J, Ng HS, Poyser C, Lucas RM, Tremlett H. Multiple sclerosis incidence: a systematic review of change over time by geographical region. Mult Scler Relat Disord 2022; 63:103932. doi: 10.1016/j.msard.2022.103932 [Crossref] [ Google Scholar]
- Oh J, Vidal-Jordana A, Montalban X. Multiple sclerosis: clinical aspects. Curr Opin Neurol 2018; 31(6):752-9. doi: 10.1097/wco.0000000000000622 [Crossref] [ Google Scholar]
- Correale J, Gaitán MI, Ysrraelit MC, Fiol MP. Progressive multiple sclerosis: from pathogenic mechanisms to treatment. Brain 2017; 140(3):527-46. doi: 10.1093/brain/aww258 [Crossref] [ Google Scholar]
- Gelfand JM. Multiple sclerosis: diagnosis, differential diagnosis, and clinical presentation. Handb Clin Neurol 2014; 122:269-90. doi: 10.1016/b978-0-444-52001-2.00011-x [Crossref] [ Google Scholar]
- Cunniffe N, Coles A. Promoting remyelination in multiple sclerosis. J Neurol 2021; 268(1):30-44. doi: 10.1007/s00415-019-09421-x [Crossref] [ Google Scholar]
- Franklin RJ. Why does remyelination fail in multiple sclerosis?. Nat Rev Neurosci 2002; 3(9):705-14. doi: 10.1038/nrn917 [Crossref] [ Google Scholar]
- Ffrench-Constant C, Raff MC. Proliferating bipotential glial progenitor cells in adult rat optic nerve. Nature 1986; 319(6053):499-502. doi: 10.1038/319499a0 [Crossref] [ Google Scholar]
- Forbes LH, Miron VE. Monocytes in central nervous system remyelination. Glia 2022; 70(5):797-807. doi: 10.1002/glia.24111 [Crossref] [ Google Scholar]
- Lee SC, Liu W, Brosnan CF, Dickson DW. GM-CSF promotes proliferation of human fetal and adult microglia in primary cultures. Glia 1994; 12(4):309-18. doi: 10.1002/glia.440120407 [Crossref] [ Google Scholar]
- Vellenga E, Rambaldi A, Ernst TJ, Ostapovicz D, Griffin JD. Independent regulation of M-CSF and G-CSF gene expression in human monocytes. Blood 1988; 71(6):1529-32. [ Google Scholar]
- Mencoboni M, Lerza R, Bogliolo G. [Tumor necrosis factor: a cytokine with multiple actions]. Recenti Prog Med 1992;83(1):15-7. [Italian].
- Logan TF, Gooding W, Kirkwood JM, Shadduck RK. Tumor necrosis factor administration is associated with increased endogenous production of M-CSF and G-CSF but not GM-CSF in human cancer patients. Exp Hematol 1996; 24(1):49-53. [ Google Scholar]
- Guo M, Tang X, Sheng X, Xing J, Zhan W. The effects of IL-1β, IL-8, G-CSF and TNF-α as molecular adjuvant on the immune response to an E tarda subunit vaccine in flounder (Paralichthysolivaceus). Fish Shellfish Immunol 2018; 77:374-84. doi: 10.1016/j.fsi.2018.04.009 [Crossref] [ Google Scholar]
- Ishizu T, Minohara M, Ichiyama T, Kira R, Tanaka M, Osoegawa M. CSF cytokine and chemokine profiles in acute disseminated encephalomyelitis. J Neuroimmunol 2006; 175(1-2):52-8. doi: 10.1016/j.jneuroim.2006.03.020 [Crossref] [ Google Scholar]
- Tsai RK, Chang CH, Wang HZ. Neuroprotective effects of recombinant human granulocyte colony-stimulating factor (G-CSF) in neurodegeneration after optic nerve crush in rats. Exp Eye Res 2008; 87(3):242-50. doi: 10.1016/j.exer.2008.06.004 [Crossref] [ Google Scholar]
- Mia S, Warnecke A, Zhang XM, Malmström V, Harris RA. An optimized protocol for human M2 macrophages using M-CSF and IL-4/IL-10/TGF-β yields a dominant immunosuppressive phenotype. Scand J Immunol 2014; 79(5):305-14. doi: 10.1111/sji.12162 [Crossref] [ Google Scholar]