Biomed Res Bull. 2(1):4-11.
doi: 10.34172/biomedrb.2024.01
Original Article
Evaluation of the Effects of Melatonin-treated RAW Macrophage Cells in the A-375 Melanoma Cell Line
Mojtaba Gholinezhad 1, *  , Bahareh Sartipi 1, Ilgar Amjadi 1
Author information:
1Department of Dermatology, Sina Hospital,Tabriz University of Medical Science, Tabriz, Iran
Abstract
Background:
Melanoma is one of the most complex and invasive cancers in the world, accounting for the most deaths among skin cancers. This study investigated the effects of melatonin (MLT)-treated RAW264.7 cell lines on A-375 human melanoma cell lines.
Methods:
RAW264.7 and A-375 cells were cultured and passaged separately and then treated with 0 μM, 50 μM, 75 μM, 100 μM, 150 μM, and 200 μM concentrations of MLT. In addition, the survival rate of these cells was checked by trypan blue staining. A-375 cells were exposed to RAW264.7 cells treated with MLT for 24 hours, and their viability was evaluated with trypan blue.
Results:
After the colonization of RAW264.7 cells and treatment with different concentrations of MLT for 24 hours, it was observed that the growth and differentiation of RAW264.7 cells decreased at concentrations of 150 μM and 200 μM. In the case of A-375 cells, after 24 hours of treatment with different concentrations of MLT, the growth of malignant cells was inhibited in a dose-dependent manner. When MLT-treated RAW264.7 cells were placed in the vicinity of A-375 cells for 24 hours, the density of RAW264.7 cells was low at concentrations of 150 and 200 μM MLT, and the growth of A-375 cells was inhibited accordingly. The same results were obtained when cell viability was measured by MTT.
Conclusion:
Our findings revealed that MLT, at concentrations of 150 μM and 200 μM, inhibited the growth of A-375 cells by inhibiting the growth and reducing the differentiation of RAW macrophages. Therefore, this substance can be used in the mentioned concentrations to treat melanoma. It is also possible to examine the effect of MLT on melanoma cell line in different periods.
Keywords: Melanoma, Melatonin, A-375
Copyright and License Information
© 2024 The Author(s).
This is an open access article distributed under the terms of the Creative Commons Attribution License (
http://creativecommons.org/licenses/by/4.0/), which permits unrestricted use, distribution, and reproduction in any medium, provided the original work is properly cited.
Funding Statement
None.
Introduction
Melanoma is a skin cancer that is caused by melanocytes, which are mainly located in the epidermis layer of the skin. In addition, it is also found in the eyes, ears, gastrointestinal tract, oral mucosa, and genital system. Melanoma is the cause of the largest number of skin cancer deaths worldwide; however, it includes only 4% of skin cancers. Early diagnosis of melanoma with less thickness is the best way to reduce the mortality of this tumor.1 Currently, the incidence of melanoma is steadily increasing.2
According to the staging of melanoma, treatment methods differ and include incisional biopsy at stages I and II and chemotherapy with dacarbazine and temozolomide at stage VI.3 Unfortunately, the existing treatments have a poor prognosis, while the disease progresses to the upper stages. This informs us to seek help from other treatments such as photodynamic therapy, immunotherapy, chemotherapy, and target therapy.4 In the past years, melatonin (MLT) was one of the elements that had been considered for melanoma treatment. MLT is a hormone secreted by the pineal gland that has a role in the regulation of circadian and seasonal rhythms.5 Further, MLT has various effects on the endocrine, nervous, and immune systems.6
According to the rhythmic production of MLT, it has been shown that cell proliferation in the mammalian bone marrow and the lymphoid system follows a diurnal and seasonal rhythm,7 and lymphocytic subset proliferation,8 natural killer (NK) cell activity,9 and cytokine production10 are also rhythmic. Furthermore, considering that MLT reaches its highest level at night, the circulating lymphocytes of deer mice,11,12 tropical palm squirrels,13 and humans14 also reach their highest levels at night. Different studies suppressed the production of MLT in several ways and showed that in pinealectomized mice, the size of the thymus was 70% smaller than the thymus of control mice15,16 after 2 weeks, or in the BALB/c mouse that had been exposed to light from birth, the cortex of the thymus was devoid of lymphocytes and lymphoblasts were absent.17 In addition, among the in vivo effects of MLT, we can mention the increase in the weight of the thymus of Gerbil rats after the daily afternoon injection of MLT,18 spleen hypertrophy, and an increase in interferon-gamma (IFN-γ) in Syrian hamsters.19 Other effects of MLT on the immune system include the activation of T-cells, B-cells, NK cells, and monocytes and the release of some cytokines, such as IFN-γ, interleukin-1 (IL)-1, IL-2, IL-6, and IL-12.20-25
In this study, the immune feature of MLT is of interest, especially since studies recently conducted on the effects of MLT on melanoma have shown that MLT has an inhibitory effect on the growth of melanoma cells.
Materials and Methods
Cell Culture
RAW264.7 Cell Line Culture
The RAW264.7 cell line was obtained from the Tehran Pasteur Cell Bank in flasks. After observing the flask with an inverted microscope and ensuring the health of the cells, the flask was transferred to the CO2 greenhouse and incubated at 37˚C. After 3 days, with changing the environment color, the flask was transferred to the sterilized class II laminar hood, and the supernatant was centrifuged at 1200 rpm for 5 minutes. Next, the cell mass was dissolved in a 1 cc high glucose Dulbecco’s modified eagle medium (DMEM), and the number of living cells was counted by trypan blue. Finally, the cells were cultured in the new medium containing 90% high glucose complete DMEM, 10% fetal bovine serum (FBS), 1% Pen-Strep antibiotic (penicillin + streptomycin), and 2% L-glutamine in a greenhouse with 5% CO2 and 95% humidity at 37 ˚C. Cell passage was performed after filling 80% of the flask space.
A-375 Cell Line Culture
A-375 cells were obtained as a frozen vial from the liquid nitrogen tank of the Pasteur Institute of Tehran. Then, to defreeze the cells, first, the cryotube was transferred inside the sterilized class II laminar hood. After the cryotube reached the same temperature as the ambient temperature, 2 cc of the RPMI medium was added to the cell suspension. After centrifuging at 2000 rpm for 5 minutes, the supernatant was removed, and 1 cc of RPMI medium was added to the cell mass. The rate of survival was determined with the trypan blue staining method. The cells were transferred to a complete medium containing 90% RPMI, 10% FBS, and 1% Pen-Strep and incubated in a greenhouse with 5% CO2 and 95% humidity at 37 ˚C. Finally, cell suspension with a volume of 190% FBS and 10% dimethyl sulfoxide (DMSO) was transferred to a cell cryotube and frozen at -80°C, and stored in a nitrogen tank.
3-(4, 5-Dimethylthiazolyl-2)-2, 5-Diphenyltetrazolium Bromide Toxicity Assay
3-(4, 5-Dimethylthiazolyl-2)-2, 5-Diphenyltetrazolium Bromide Toxicity Assay for RAW264.7 Cells
After incubating the cells for 24 hours in 24-well plates, each well containing cell was treated with a different concentration of 0 µM, 50 µM, 75 µM, 100 µM, 150 µM, and 200 µM MLT (MLT powder was prepared as a suspension in a high glucose DMEM without FBS and sterilized with a 0.2 μm filter). Then, the desired dilutions were prepared and incubated for 24 hours in the greenhouse with an atmosphere of 5% CO2 and 95% humidity at 37 °C. The morphological characteristics of the cells after 24 hours of treatment with MLT were examined and recorded with an inverted microscope. The supernatant was removed, and the MTT solution with a concentration of 50 mg/mL was added to the treated cells at a ratio of 1:10 with a fresh medium. The cells were incubated for 4 hours at 37 °C, then an equal concentration of DMSO was added, and the resulting suspension was transferred to the 96-well plates after several times of pipetting. Finally, the light absorption created at the wavelength of 540 nm was read by an enzyme-linked immunosorbent assay (ELISA) reader.
The selection of different concentrations of MLT was based on an article by Ban et al, who did the microarray analysis of the gene expression profile in lipopolysaccharide (LPS)-stimulated RAW264.7 cells in response to melatonin treatment. For this purpose, they treated the above-mentioned cells with concentrations of 0 µM, 50 µM, 100 µM, and 500 µM MLT.
3-(4, 5-Dimethylthiazolyl-2)-2, 5-Diphenyltetrazolium Bromide Toxicity Assay for A-375 Cell Lines
The A-375 cells were transferred to 48-well plates and incubated. Then, 6 wells containing malignant cells were treated with different concentrations of 0 µM, 50 µM, 75 µM, 100 µM, 150 µM, and 200 µM MLT and incubated for 24 hours in the greenhouse with an atmosphere of 5% CO2 and 95% humidity at 37 °C. The morphological characteristics of the cells after 24 hours of treatment with MLT were examined and recorded with an inverted microscope. Subsequently, they were centrifuged at 2000 rpm for 5 minutes. The supernatant was removed from the surface of the cells. The resulting suspension was transferred to 96-well flat-bottom plates, and the MTT solution with a concentration of 50 mg/mL at a ratio of 1:10 was added and then incubated for 4 hours at 37 °C. An equal concentration of DMSO was added after several times of pipetting, and finally, the light absorption created at the wavelength of 540 nm was read by the ELISA reader.
3-(4, 5-Dimethylthiazolyl-2)-2, 5-Diphenyltetrazolium Bromide Toxicity Assay for A-375 Cell Lines After Exposure to Melatonin-treated RAW264.7
We had RAW264.7 cells in high glucose DMEM after 24 hours of treatment with 0 µM, 50 µM, 75 µM, 100 µM, 150 µM, and 200 µM concentrations of MLT. On the other hand, we had A-375 cell lines floating in high glucose DMEM after centrifugation. The floating A-375 cells were added to wells containing RAW264.7 cells treated with a certain concentration of MLT, so that the number of A-375 cells was equal to that of RAW264.7 cells. The cells were cultured together for 24 hours. Then, the morphological characteristics of the floating A-375 cells after exposure to MLT-treated RAW264.7 were examined and recorded with an inverted microscope. The non-adherent A-375 cells were slowly isolated, and after counting with trypan blue, an MTT toxicity assay was performed for the A-375 cell lines. Next, an equal concentration of DMSO was added, and after several times of pipetting, the light absorption created at the wavelength of 540 nm was read by the ELISA reader.
Measurement of the Production of Myeloperoxidase From the Supernatant of RAW264.7 Cells
MPO plays a key role in the innate immune system and regulates inflammation through the production of active species and the oxidation of vital molecules such as lipids and proteins. Therefore, it is possible to understand the function of the cells to some extent by measuring MPO in the immune cells under the influence of a specific disease.
After the treatment of RAW264.7 cells with different concentrations of MLT, the supernatant of RAW264.7 cells was separated and centrifuged at 2500 rpm for 15 minutes. From the supernatant of each concentration, 10 µL was separately transferred to flat-bottom 96-well plates. In addition, 80 µL of a 0.75 µM H2O2 solution was added to the supernatant. Then, from the 3,3’,5,5’-tetramethylbenzidine solution (2.9 mM of 3,3’,5,5’-tetramethylbenzidine was dissolved in 14.5% of DMSO), 110 µL was added to each sample. The samples were incubated for 5 minutes at 37 °C. Subsequently, 50 µL of H2SO4 was added to all samples. After several times of pipetting of the resulting suspension, the light absorption was read at a wavelength of 450 nm by the ELISA reader.
Measurement of the Production of Nitric Oxide in the Supernatant of RAW264.7 Cells by the Grease Method
NO measurement of RAW264.7 cells under treatment with different concentrations of MLT can, to some extent, indicate the kind of cell activity. Therefore, the steps were as follows:
After treating RAW264.7 cells at different concentrations of MLT, separating the supernatant of RAW264.7 cells, and centrifuging it at 2,500 rpm for 15 minutes, the supernatant of each concentration was diluted 1:1 with a high glucose DMEM. The same volume of the grease reagent (0.5% sulfanilic acid, 0.002% 1-N naphthyl-ethylene diamine dihydrochloride, and 14% glacial acetic acid) was added for each sample. All the samples were slowly pipetted, and light absorption was read at the wavelength of 570 nm by the ELISA reader.
Statistical Analysis
The Kolmogorov-Smirnov test was used to determine the normality of the tests. Considering that not all the data had a normal distribution, instead of the analysis of variance test, the Kruskal-Wallis test was utilized to compare multiple data and to compare two data with Ben Freddie’s adjustment. Each experiment was repeated at least three times, and the results were reported as means ± standard deviations (SD). The obtained data were evaluated using Minitab software (version 17) and Kruskal-Wallis and Mann-Whitney tests. The results were considered significant at P ≥ 0.05.
Results
The morphological characteristics of the RAW264.7 macrophage cell line in the DMEM revealed that the cells grew in layers and formed colonies, which is the best time to re-cultivate the cells. The differentiation of the cells appeared after 8–12 days. The cells became spindle-shaped to pyramidal, and processes appeared on the cell surface. At this time, the cells were highly sensitive to separation from the flask and underwent apoptosis in less than 5 days (Figure 1).
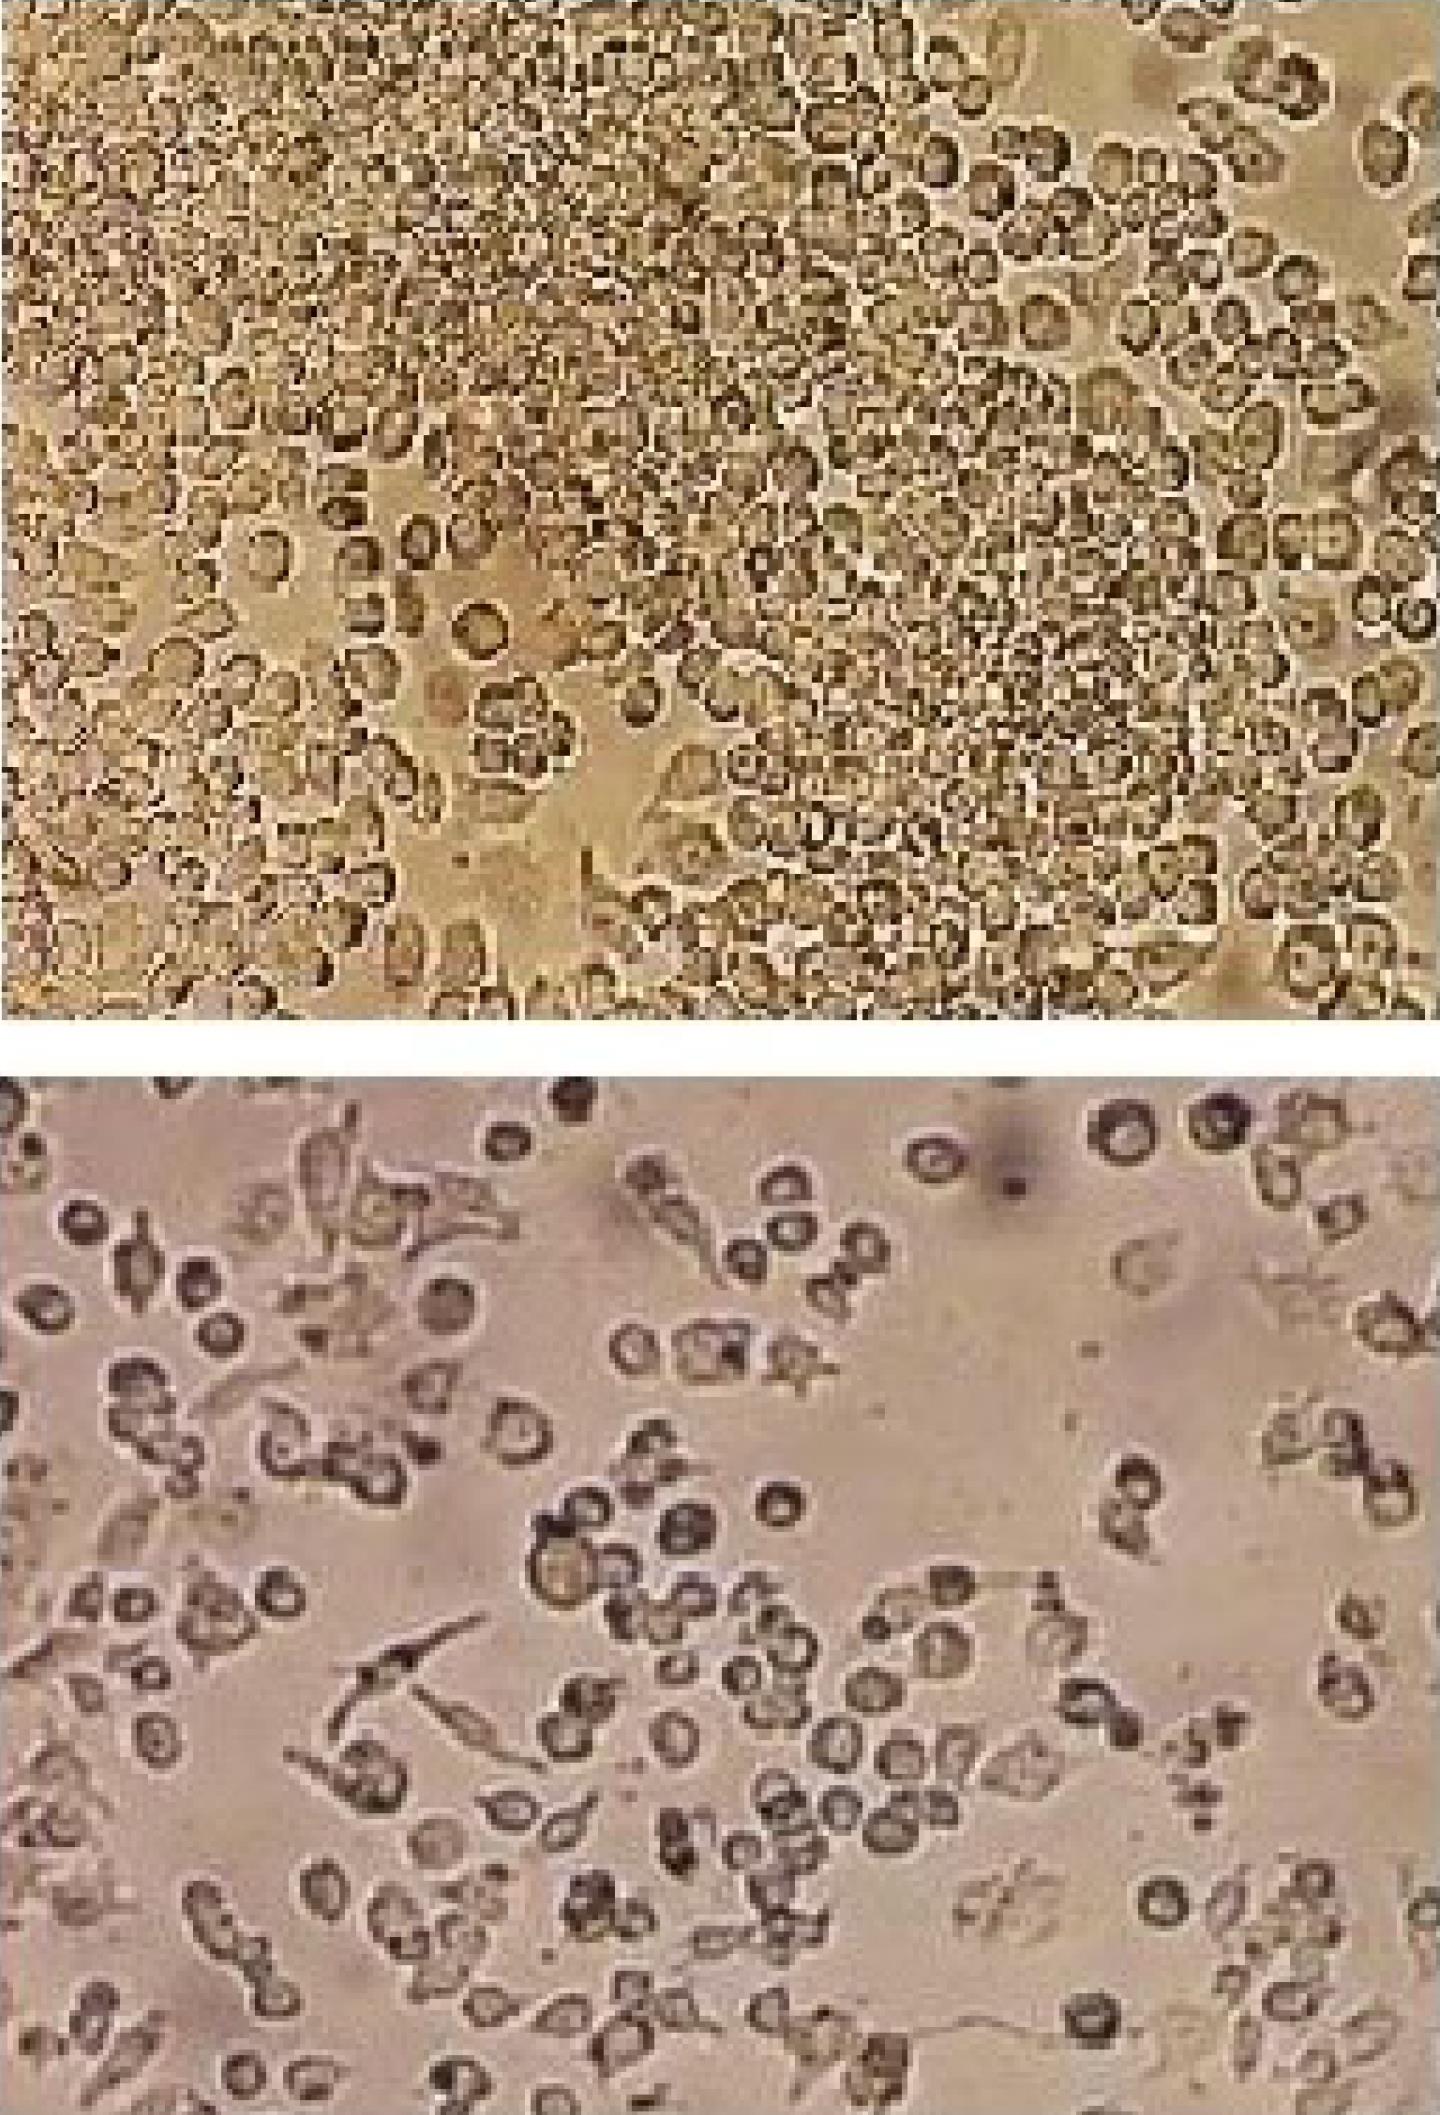
Figure 1.
Morphology of the RAW264.7 Macrophage Cell Lines Under the Light Microscope. Note. The RAW264.7 cells were grown as colonies in the DMEM. After 8–12 days, their differentiation appeared, the cells became spindle-shaped and pyramidal, and the processes were created on the cell surface
.
Morphology of the RAW264.7 Macrophage Cell Lines Under the Light Microscope. Note. The RAW264.7 cells were grown as colonies in the DMEM. After 8–12 days, their differentiation appeared, the cells became spindle-shaped and pyramidal, and the processes were created on the cell surface
MLT at concentrations of 0 μM, 50 μM, 75 μM, 100 μM, 150 μM, and 200 μM was added to each well containing RAW macrophage cells and incubated in the greenhouse under special conditions (as mentioned earlier) for 24 hours. In the morphological examination of the cells at different concentrations of MLT, the cells showed differences both in terms of number and appearance. Cell line morphology studies demonstrated that 24 hours of MLT treatment increased the number of cells and caused differentiation at lower concentrations of MLT. At concentrations of 50 μM and 75 μM, differentiation was observed in the form of processes and protrusions on the surface of the cells, but at higher concentrations, this result was the opposite (Figure 2).
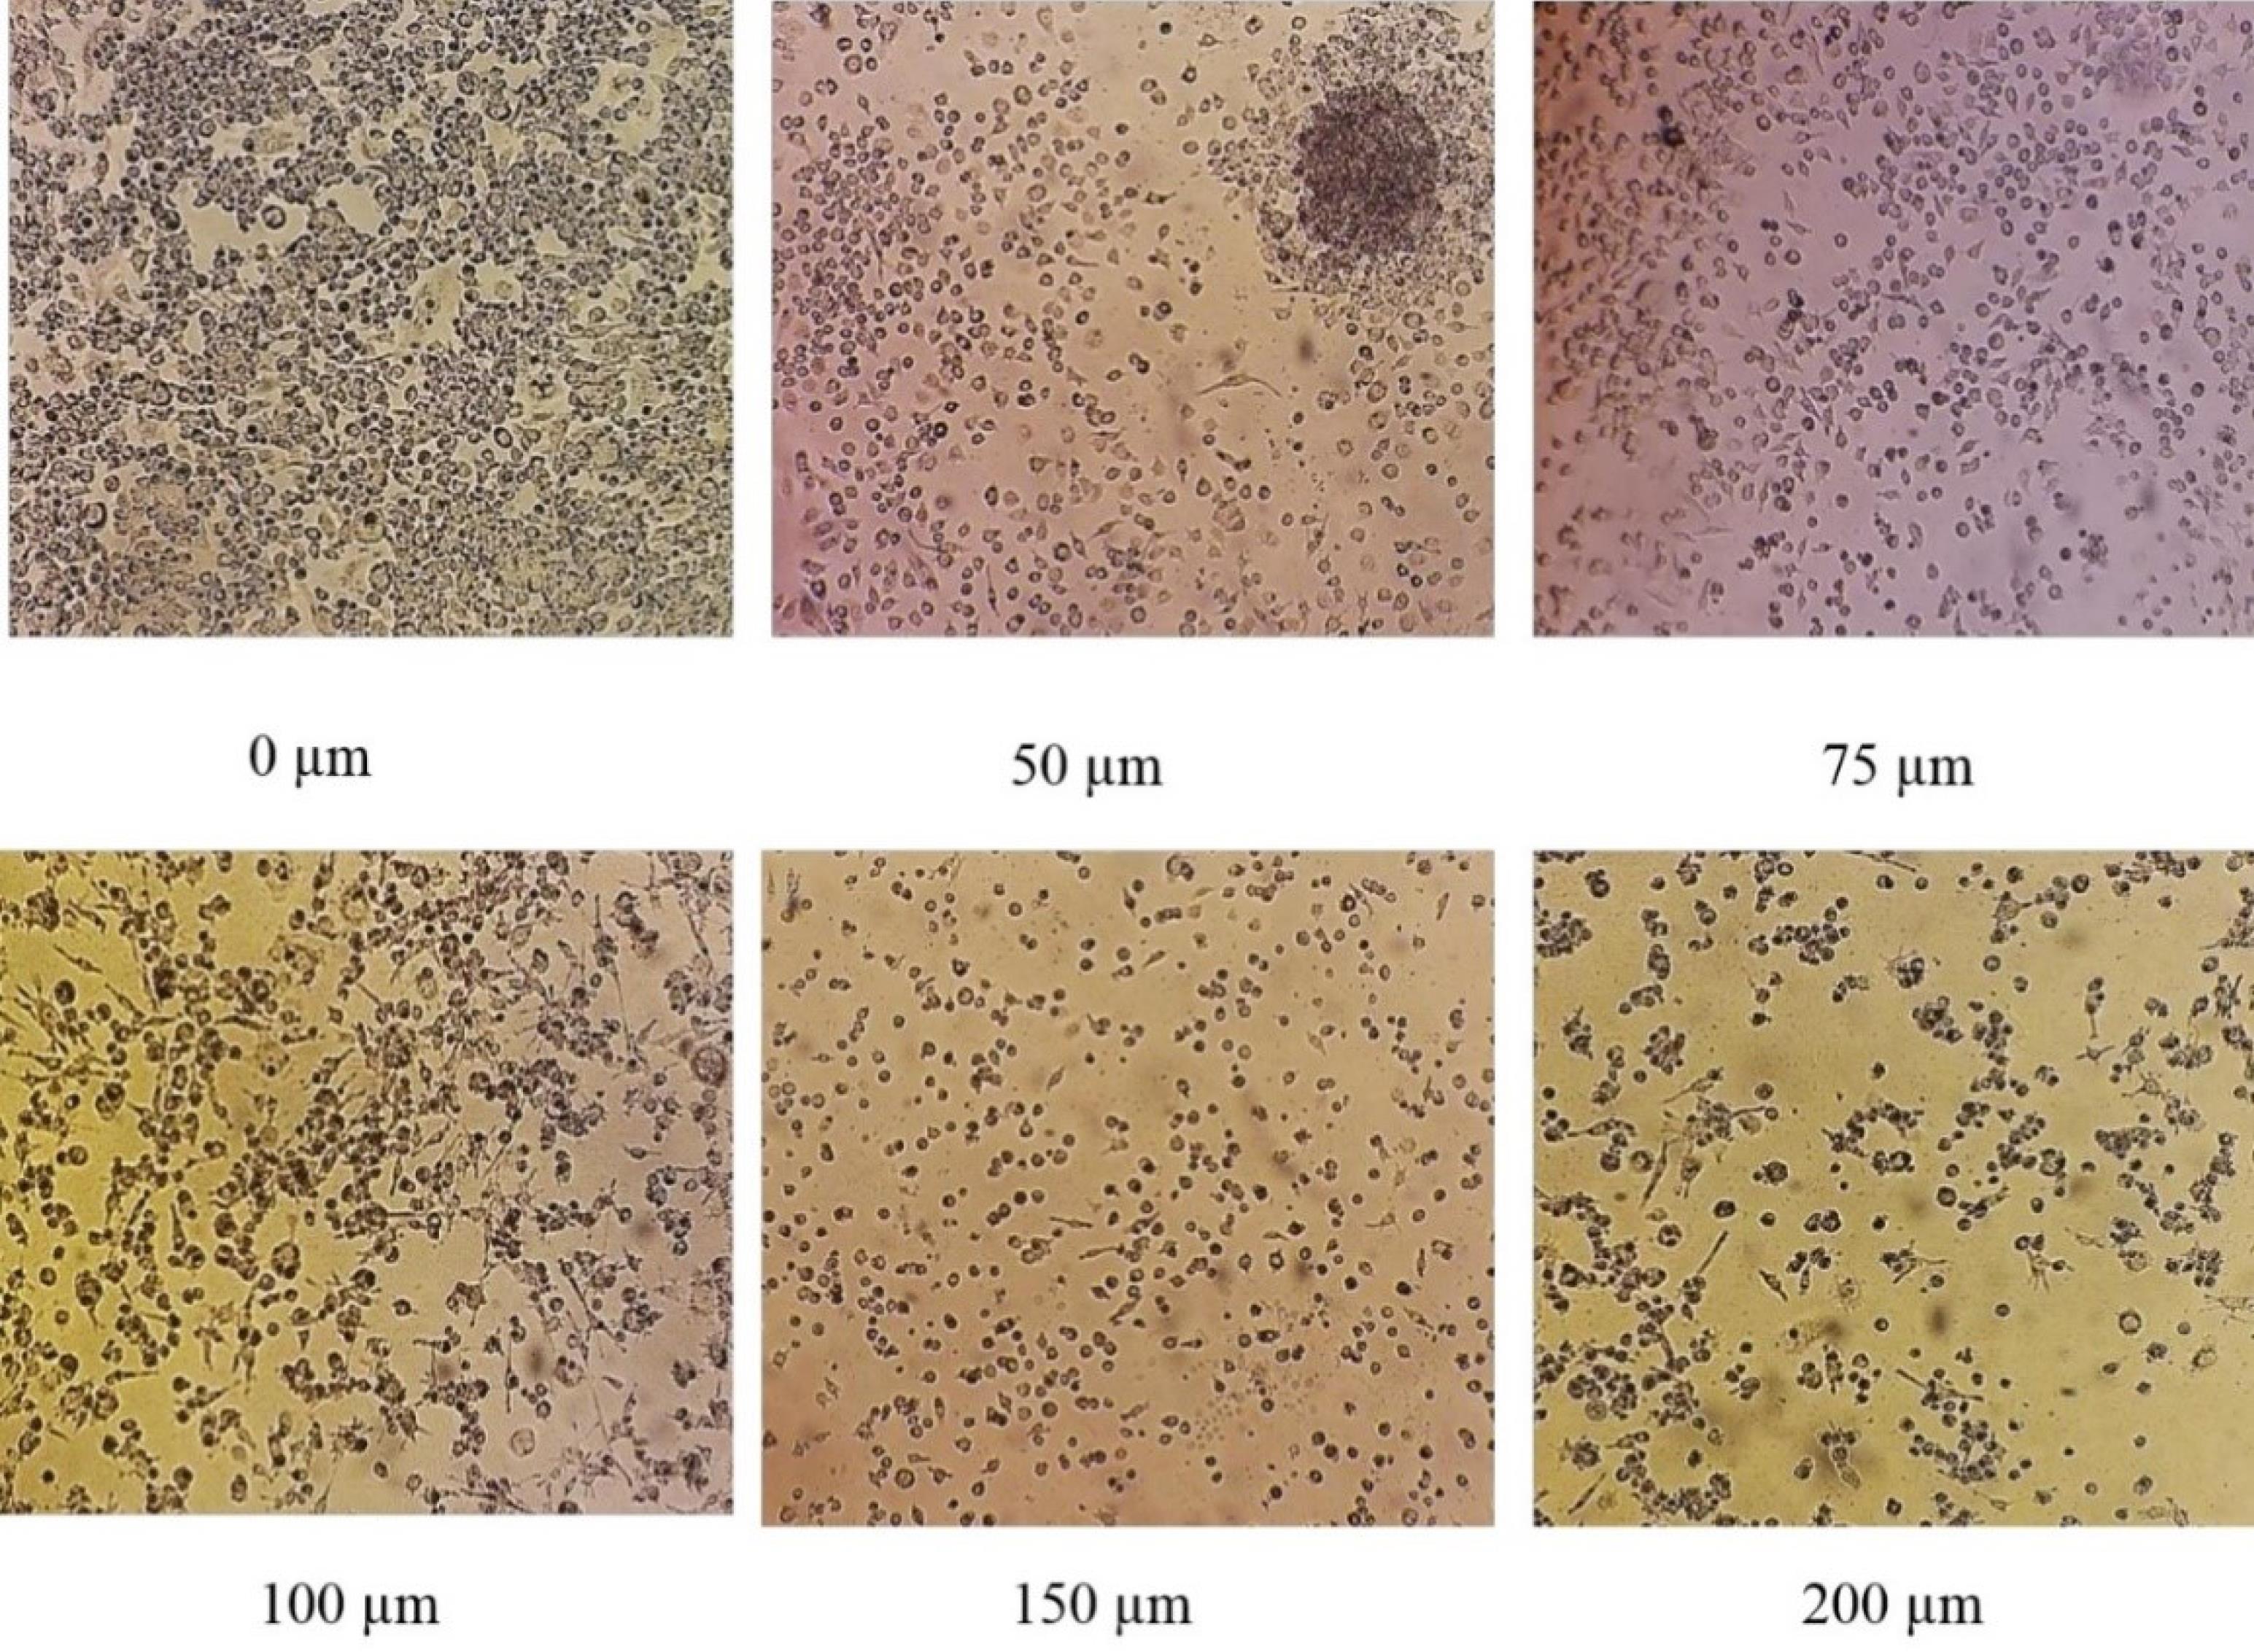
Figure 2.
Morphology of RAW Macrophage Cells Under the Inverted Phase Microscope 24 Hours After Treatment With Different Concentrations of Melatonin. Note. The number of macrophage cells increased and differentiated at low concentrations of melatonin (50 μM and 75 μM), but their number and differentiation gradually decreased at higher concentrations
.
Morphology of RAW Macrophage Cells Under the Inverted Phase Microscope 24 Hours After Treatment With Different Concentrations of Melatonin. Note. The number of macrophage cells increased and differentiated at low concentrations of melatonin (50 μM and 75 μM), but their number and differentiation gradually decreased at higher concentrations
After adding MLT at different concentrations (0 μM, 50 μM, 75 μM, 100 μM, 150 μM, and 200 μM) to 6 wells containing A-375 cells and incubating in the greenhouse under special conditions, the inhibitory effects of MLT on the growth of malignant cells were observed after 24 hours, which increased depending on the concentration of MLT, so that there was maximum cell growth inhibition at a concentration of 200 μM. Compared to the control cells, there were no significant apparent changes with concentration increasing (Figure 3).
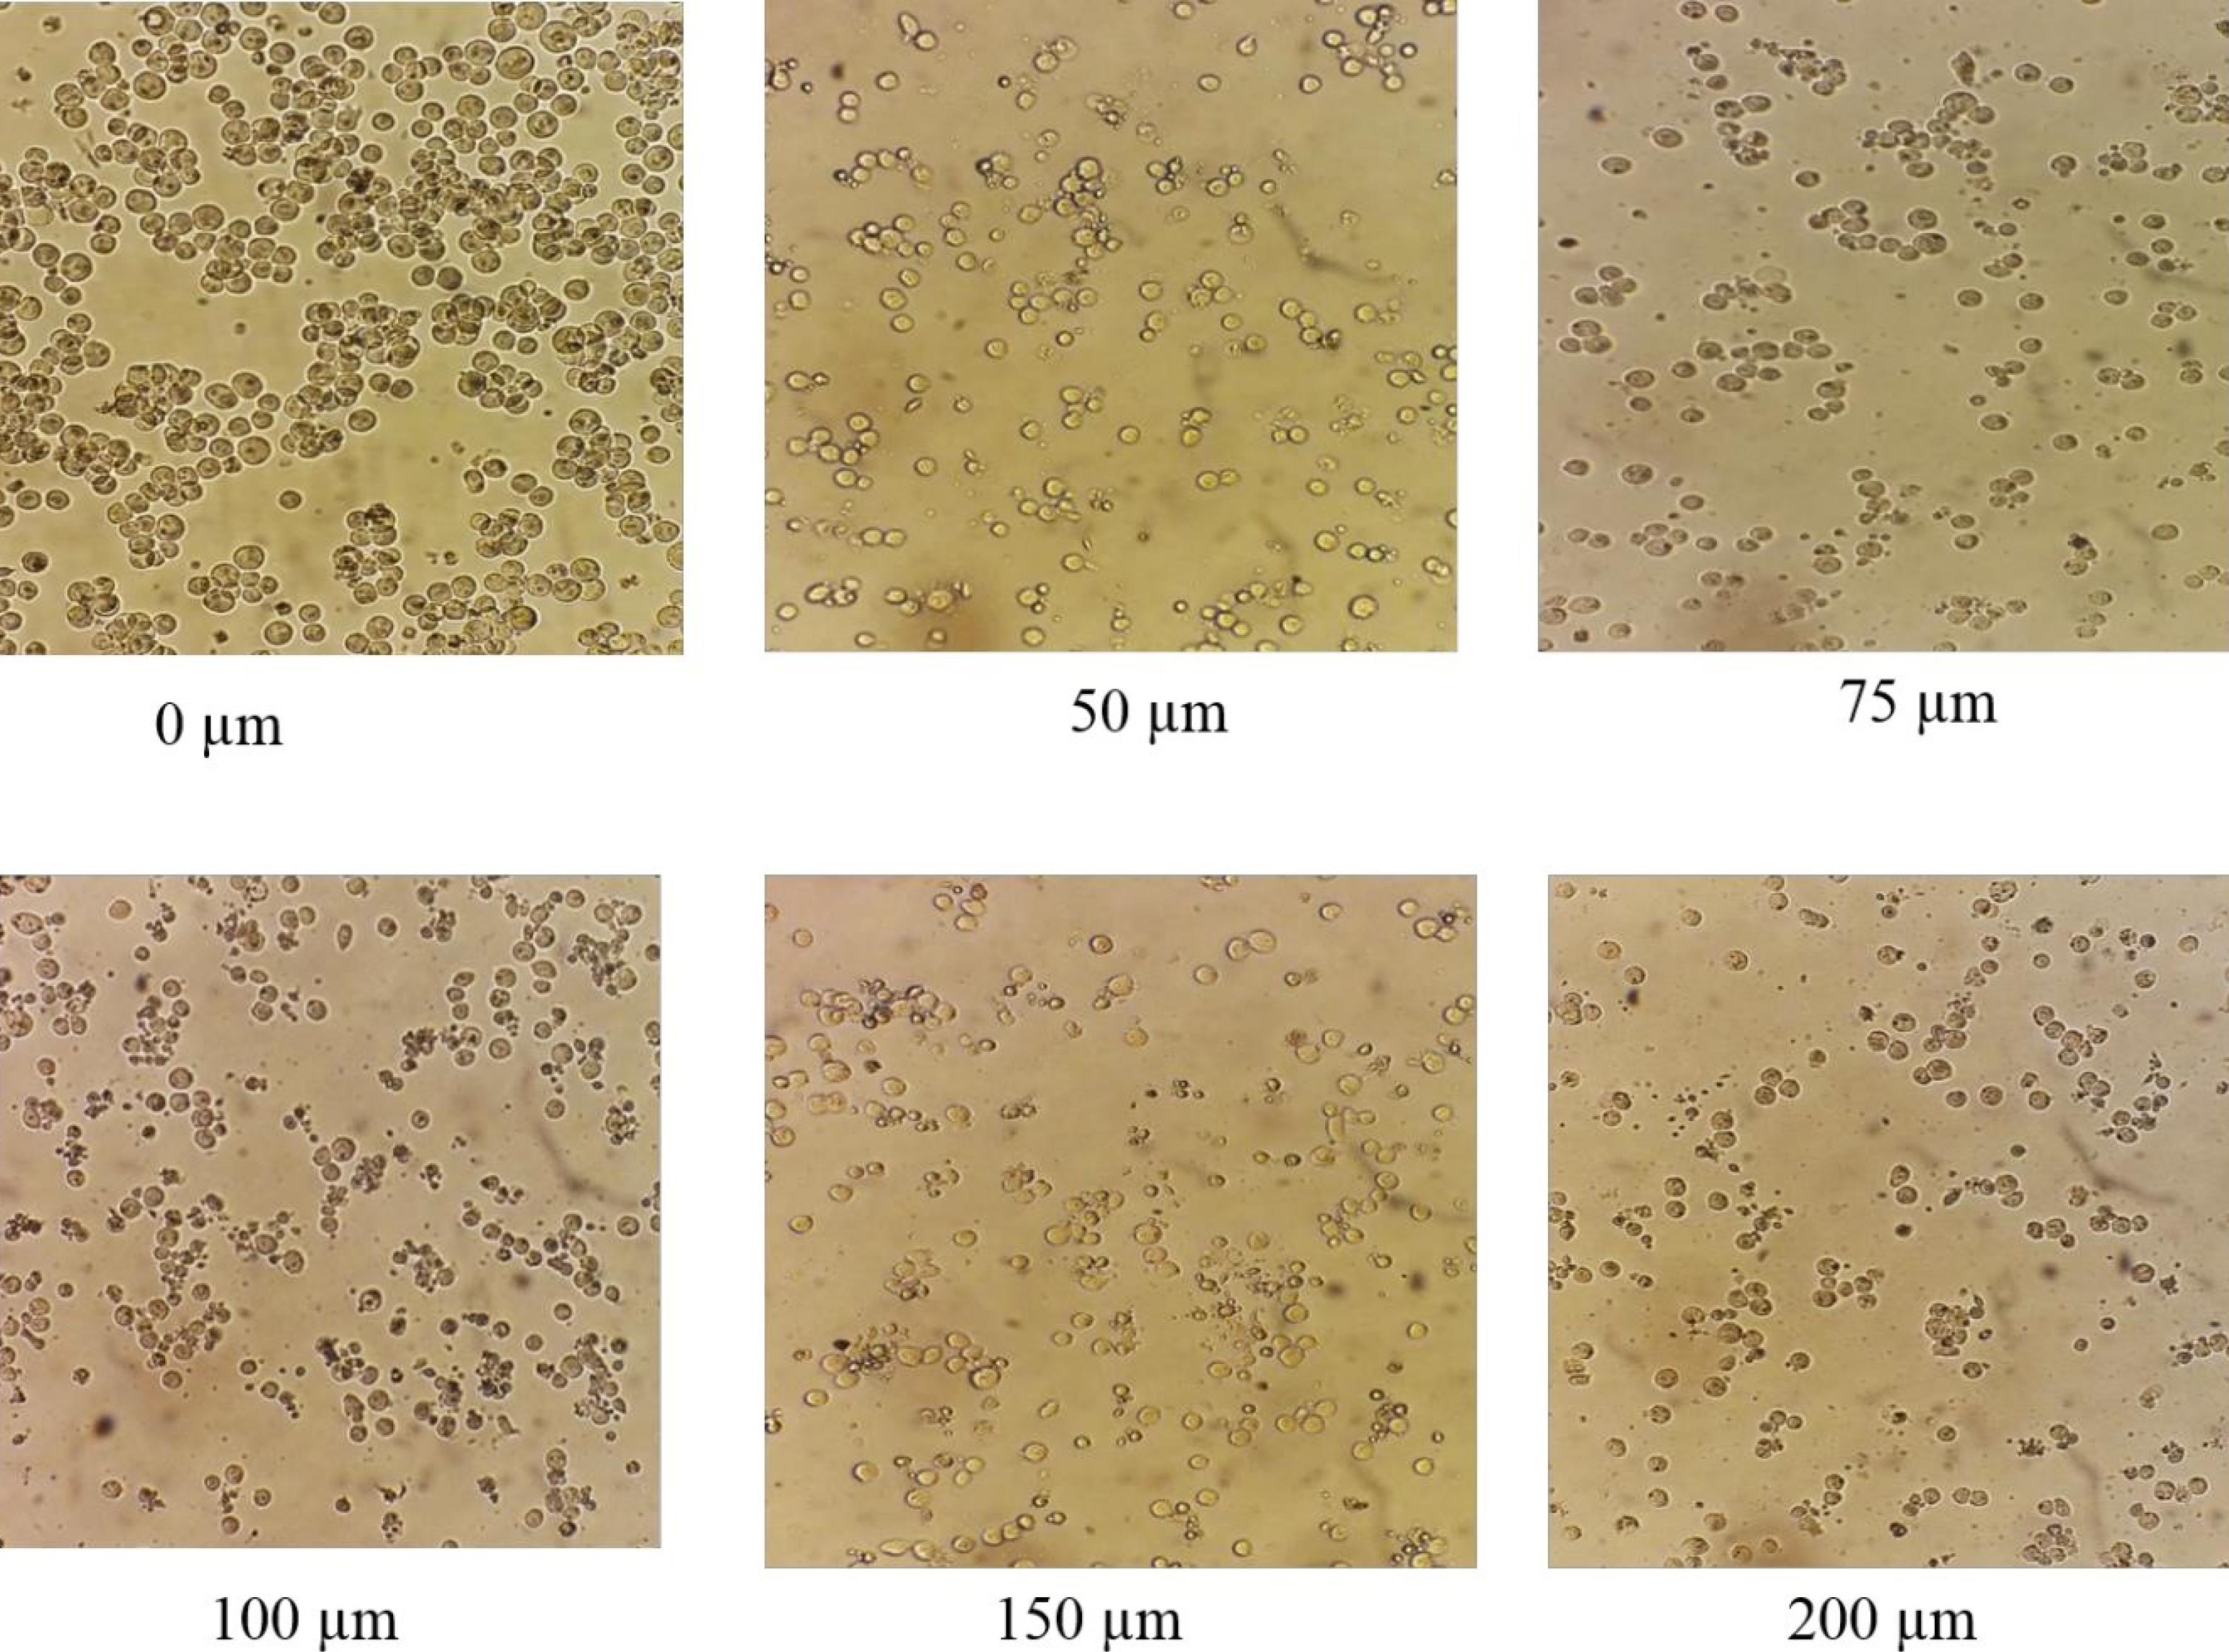
Figure 3.
Morphology of A-375 Cell Lines Under a Light Microscope After 24 Hours of Melatonin Treatment. Note. When melatonin was added to the medium of A-375 melanoma cells, it inhibited cell growth, and this inhibitory effect had a direct relationship with the melatonin concentration
.
Morphology of A-375 Cell Lines Under a Light Microscope After 24 Hours of Melatonin Treatment. Note. When melatonin was added to the medium of A-375 melanoma cells, it inhibited cell growth, and this inhibitory effect had a direct relationship with the melatonin concentration
After the treatment of RAW264.7 cells with MLT and examination of cell morphological characteristics, the survival rate of the cells was evaluated with the MTT test. The results showed that MLT inhibited the growth of RAW264.7 cells in a dose-dependent manner, so that there was the lowest number of RAW264.7 cells at a concentration of 200 μM. As mentioned, MLT at low concentrations (50 μM and 75 μM) increased the number and differentiation of RAW264.7 cells, which is in line with the results of the MTT test (Figure 4).
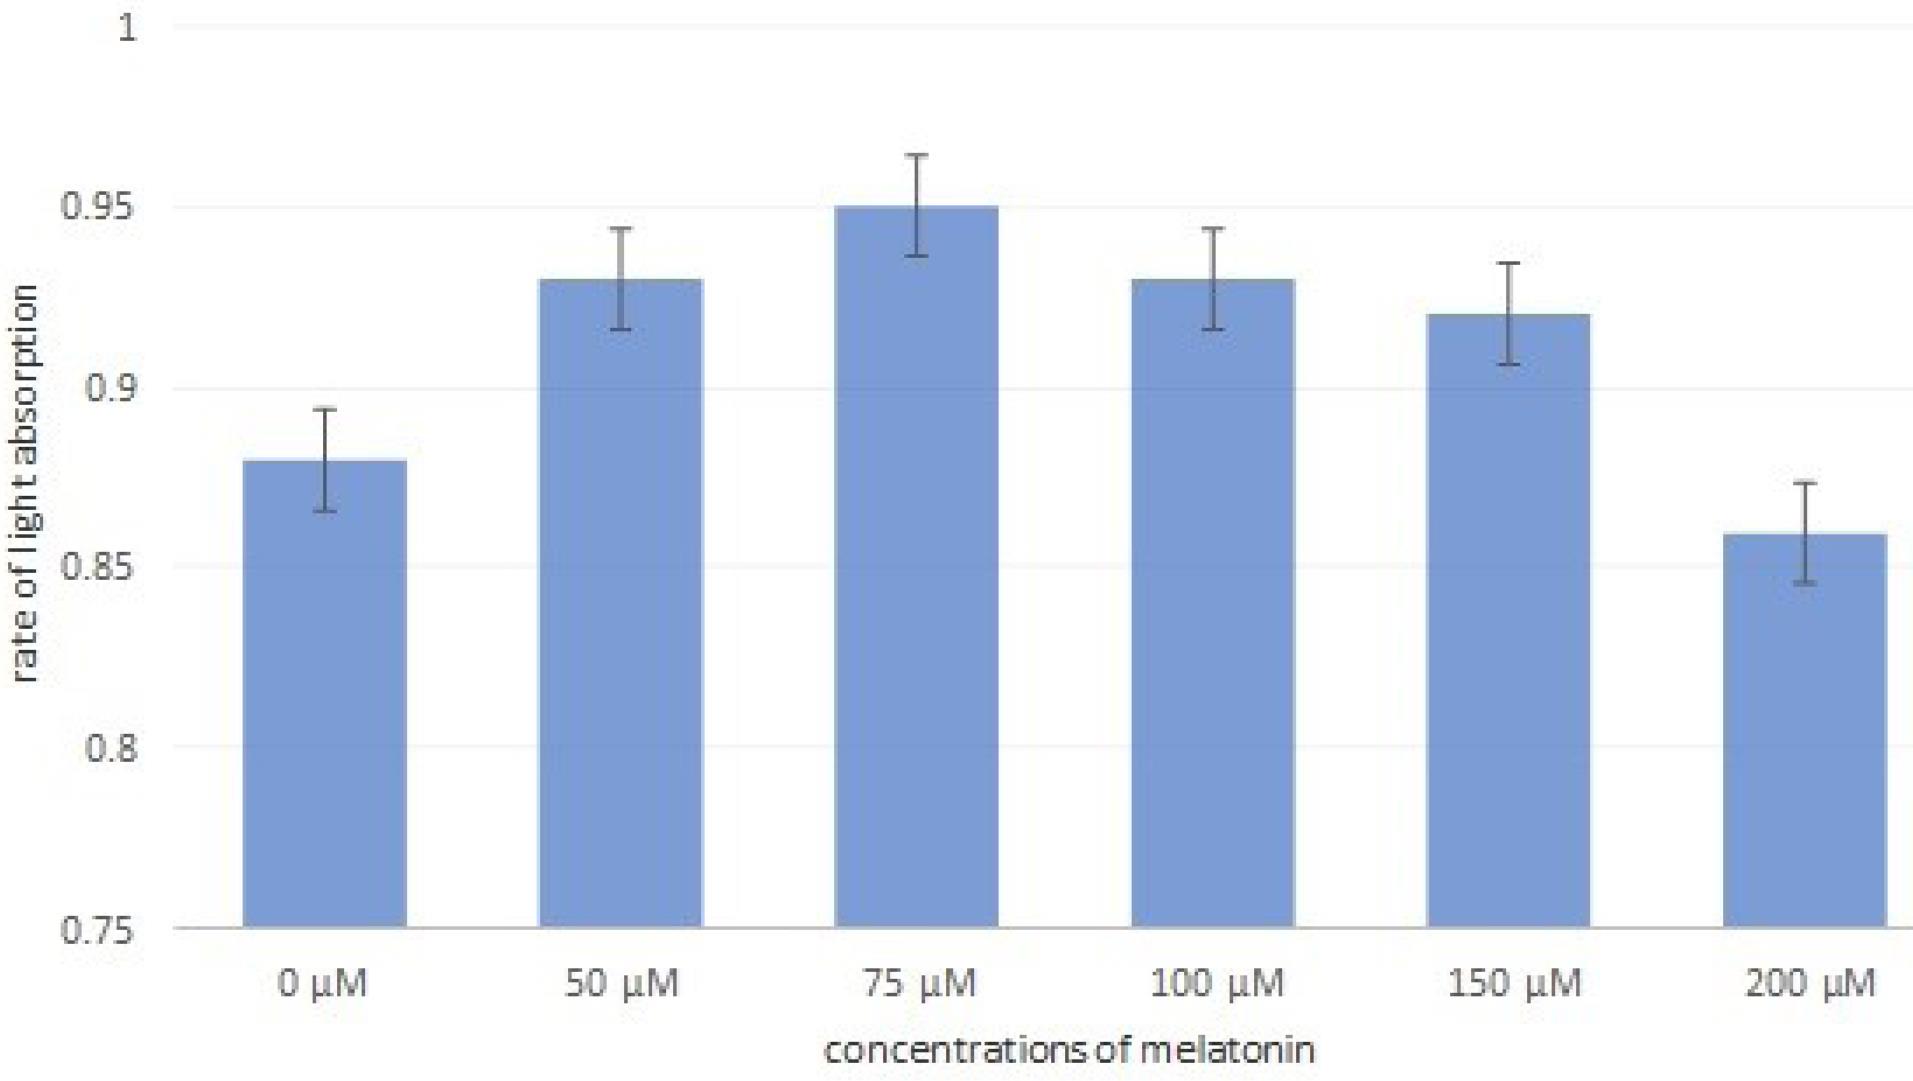
Figure 4.
Effects of Different Concentrations of Melatonin on the Survival of RAW Cells by the MTT Test. Note. Interestingly, RAW macrophages at lower concentrations (50 μM and 75 μM) could increase the number of cells. Thus, the light absorption percentage of the cells in the control well is 0.88, while this number is higher than 0.95 at the concentrations of 50 μM and 75 μM of melatonin. However, with the increase in melatonin concentration, the survival percentage of these cells decreased until it reached below the control well at 200 µM.
.
Effects of Different Concentrations of Melatonin on the Survival of RAW Cells by the MTT Test. Note. Interestingly, RAW macrophages at lower concentrations (50 μM and 75 μM) could increase the number of cells. Thus, the light absorption percentage of the cells in the control well is 0.88, while this number is higher than 0.95 at the concentrations of 50 μM and 75 μM of melatonin. However, with the increase in melatonin concentration, the survival percentage of these cells decreased until it reached below the control well at 200 µM.
When the A-375 cells were exposed to MLT for 24 hours, the results demonstrated that during 24 hours of incubation, the survival rate of A-375 cells reduced with an increase in the MLT concentration, so that the percentage of viability decreased from about 46% at the concentrations of 0 μM and 50 μM to less than 42% at the concentrations of 150 μM and 200 μM, which was a significant difference (Figure 5).
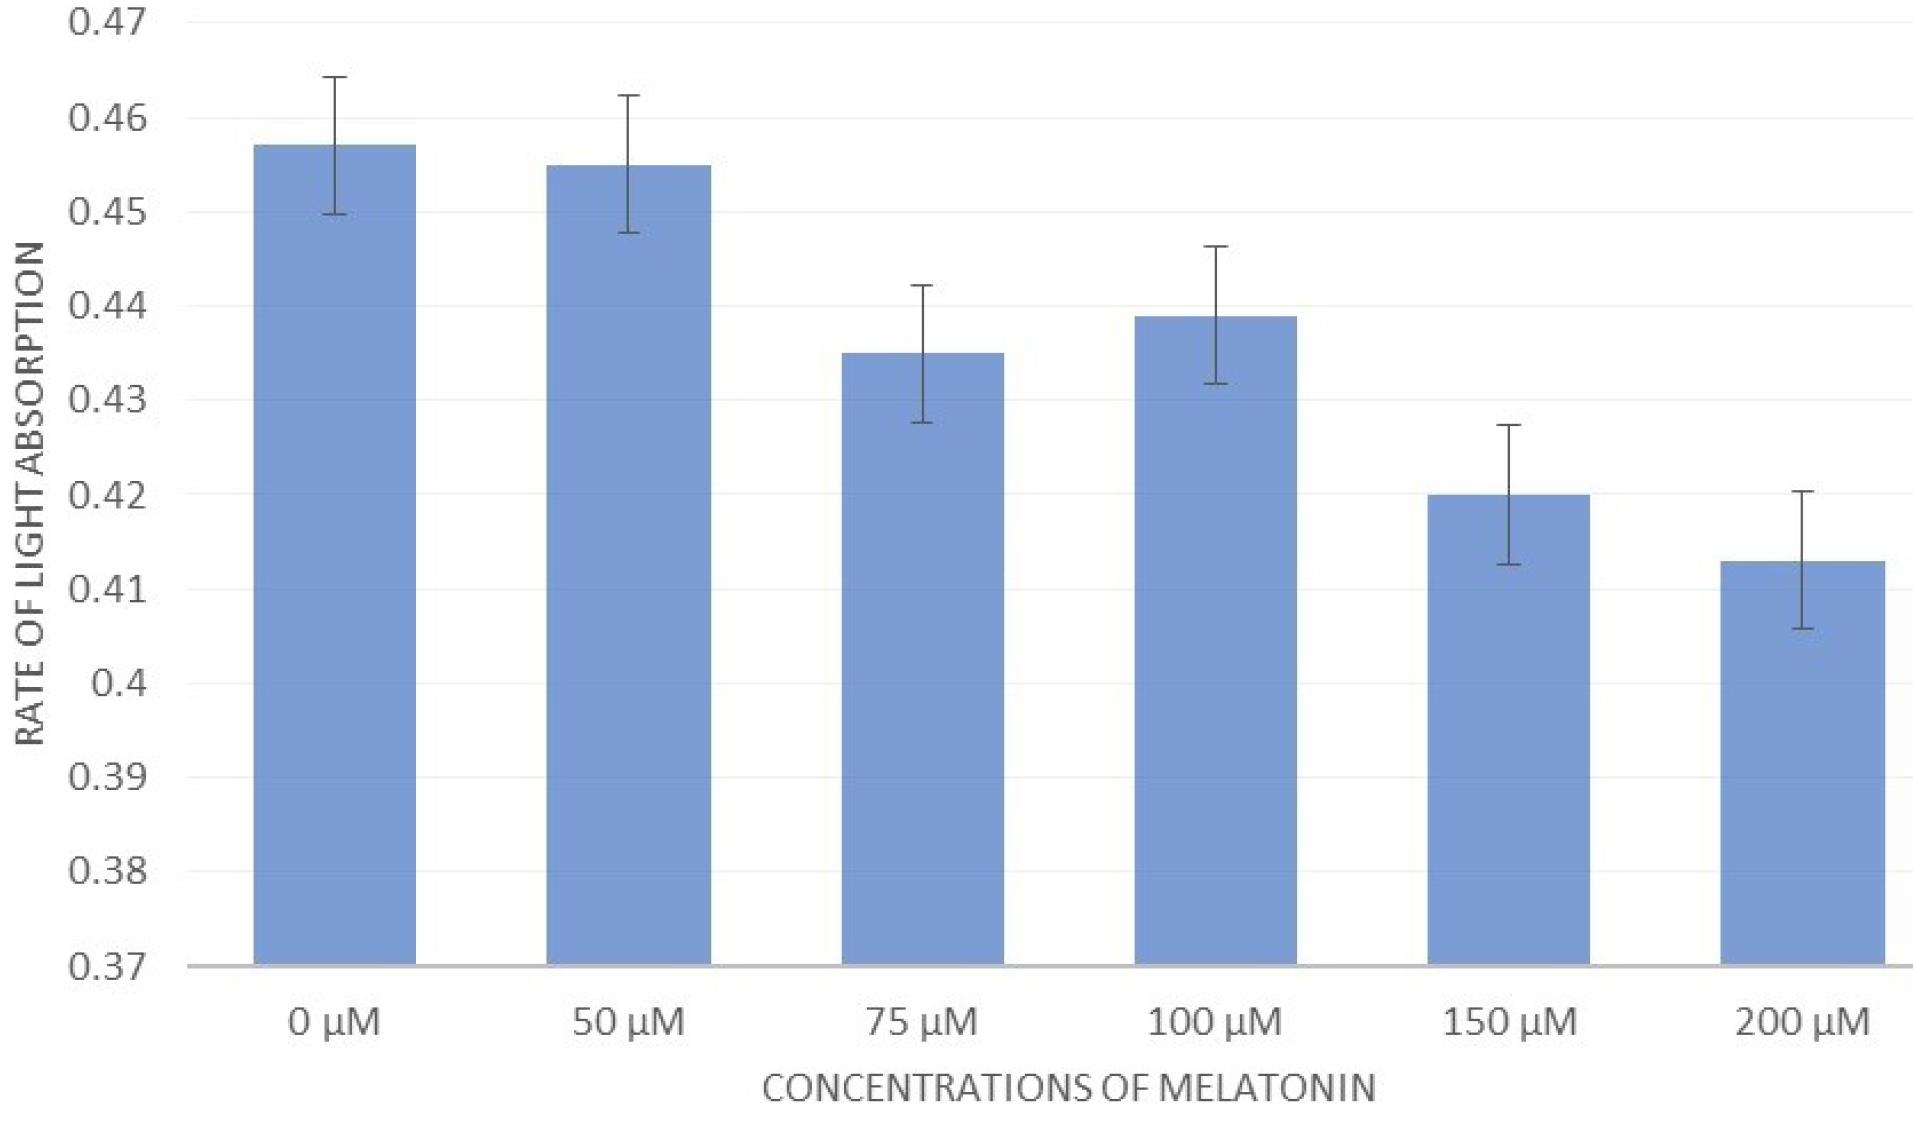
Figure 5.
The Effect of Different Concentrations of Melatonin on the A-375 Cell Line With the MTT Test. Note. MTT: 3-(4, 5-Dimethylthiazolyl-2)-2, 5-diphenyltetrazolium bromide. By increasing the concentration of melatonin in each of the wells containing A-375 cells, the growth of melatonin cells was inhibited, so that the percentage of survival decreased from 0.45% at the 0 μM concentration of melatonin to less than 0.42% at concentrations of 150 μM and 200 μM
.
The Effect of Different Concentrations of Melatonin on the A-375 Cell Line With the MTT Test. Note. MTT: 3-(4, 5-Dimethylthiazolyl-2)-2, 5-diphenyltetrazolium bromide. By increasing the concentration of melatonin in each of the wells containing A-375 cells, the growth of melatonin cells was inhibited, so that the percentage of survival decreased from 0.45% at the 0 μM concentration of melatonin to less than 0.42% at concentrations of 150 μM and 200 μM
Based on the findings of this study, the proximity of A-375 cells with RAW264.7 cells treated with different concentrations of MLT determined that at low concentrations, the number and differentiation of RAW264.7 were higher and, consequently, there were more A-375 cells. By increasing the concentration to 100 μM, 150 μM, and 200 μM, the density of RAW cells decreased, followed by the number and density of A-375. This result was visible when checking the survival percentage of melanoma cells with the MTT test (Figure 6).
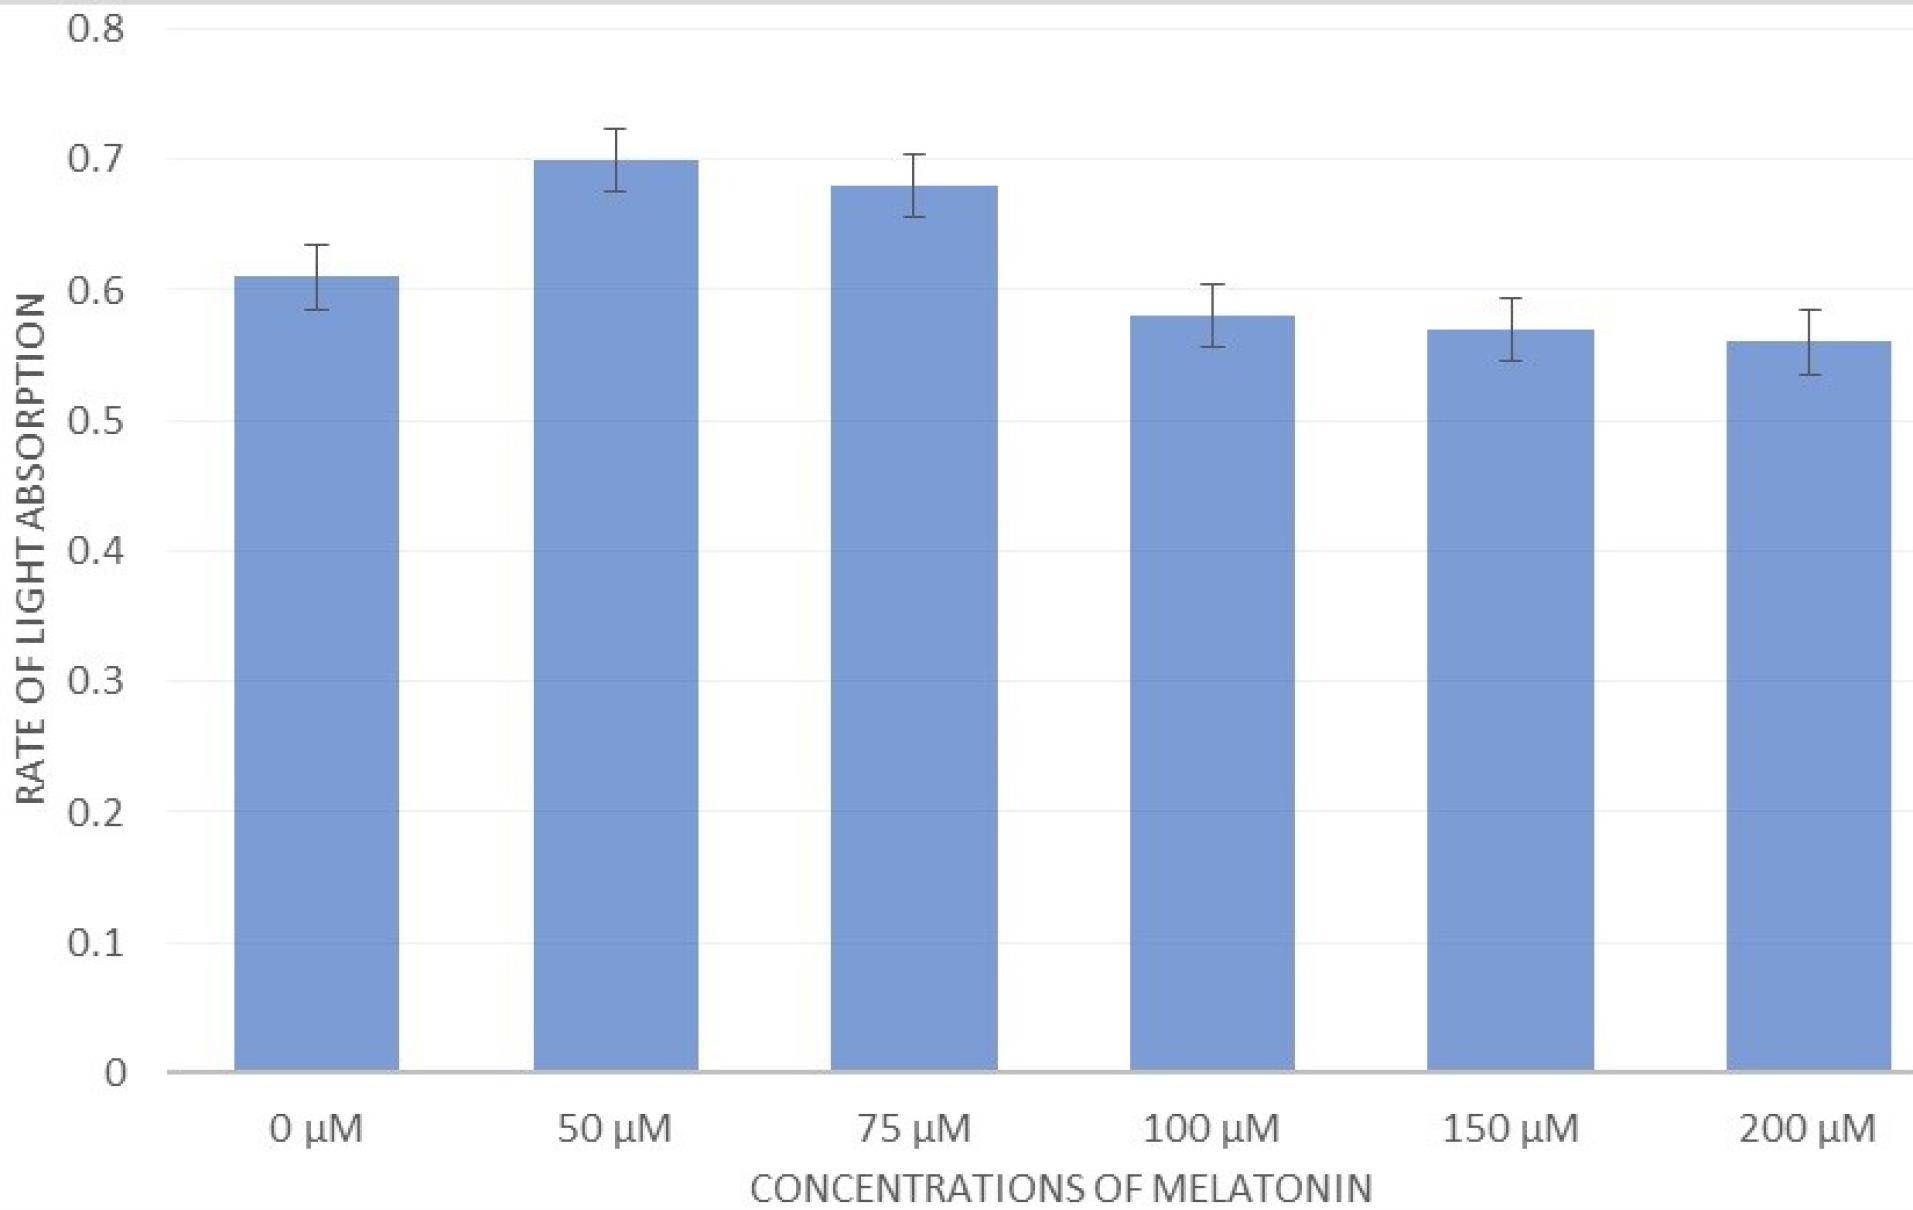
Figure 6.
The Effects of Different Concentrations of Melatonin on the A-375 Cell Line After Exposure to RAW Cells by the MTT Test. Note. MTT: 3-(4, 5-Dimethylthiazolyl-2)-2, 5-diphenyltetrazolium bromide. When placing A-375 melanoma cells in the vicinity of RAW macrophages treated with melatonin, it showed that the growth of melanoma cells gradually decreased with an increase in the concentration of melatonin. However, at lower concentrations (e.g., 50 μM and 75 μM), this inhibitory effect did not exist but had a positive effect on the growth and density of malignant cells
.
The Effects of Different Concentrations of Melatonin on the A-375 Cell Line After Exposure to RAW Cells by the MTT Test. Note. MTT: 3-(4, 5-Dimethylthiazolyl-2)-2, 5-diphenyltetrazolium bromide. When placing A-375 melanoma cells in the vicinity of RAW macrophages treated with melatonin, it showed that the growth of melanoma cells gradually decreased with an increase in the concentration of melatonin. However, at lower concentrations (e.g., 50 μM and 75 μM), this inhibitory effect did not exist but had a positive effect on the growth and density of malignant cells
Measurement of the Production of Myeloperoxidase in the Supernatant of RAW264.7 Cells
MPO activity was evaluated in the supernatant of RAW cells, and the results indicated that the concentration of MLT effective on RAW cells could decrease the level of MPO activity. In other words, the lowest level of activity, compared to the control group, was observed at the treatment concentration of 200 μM (Figure 7).
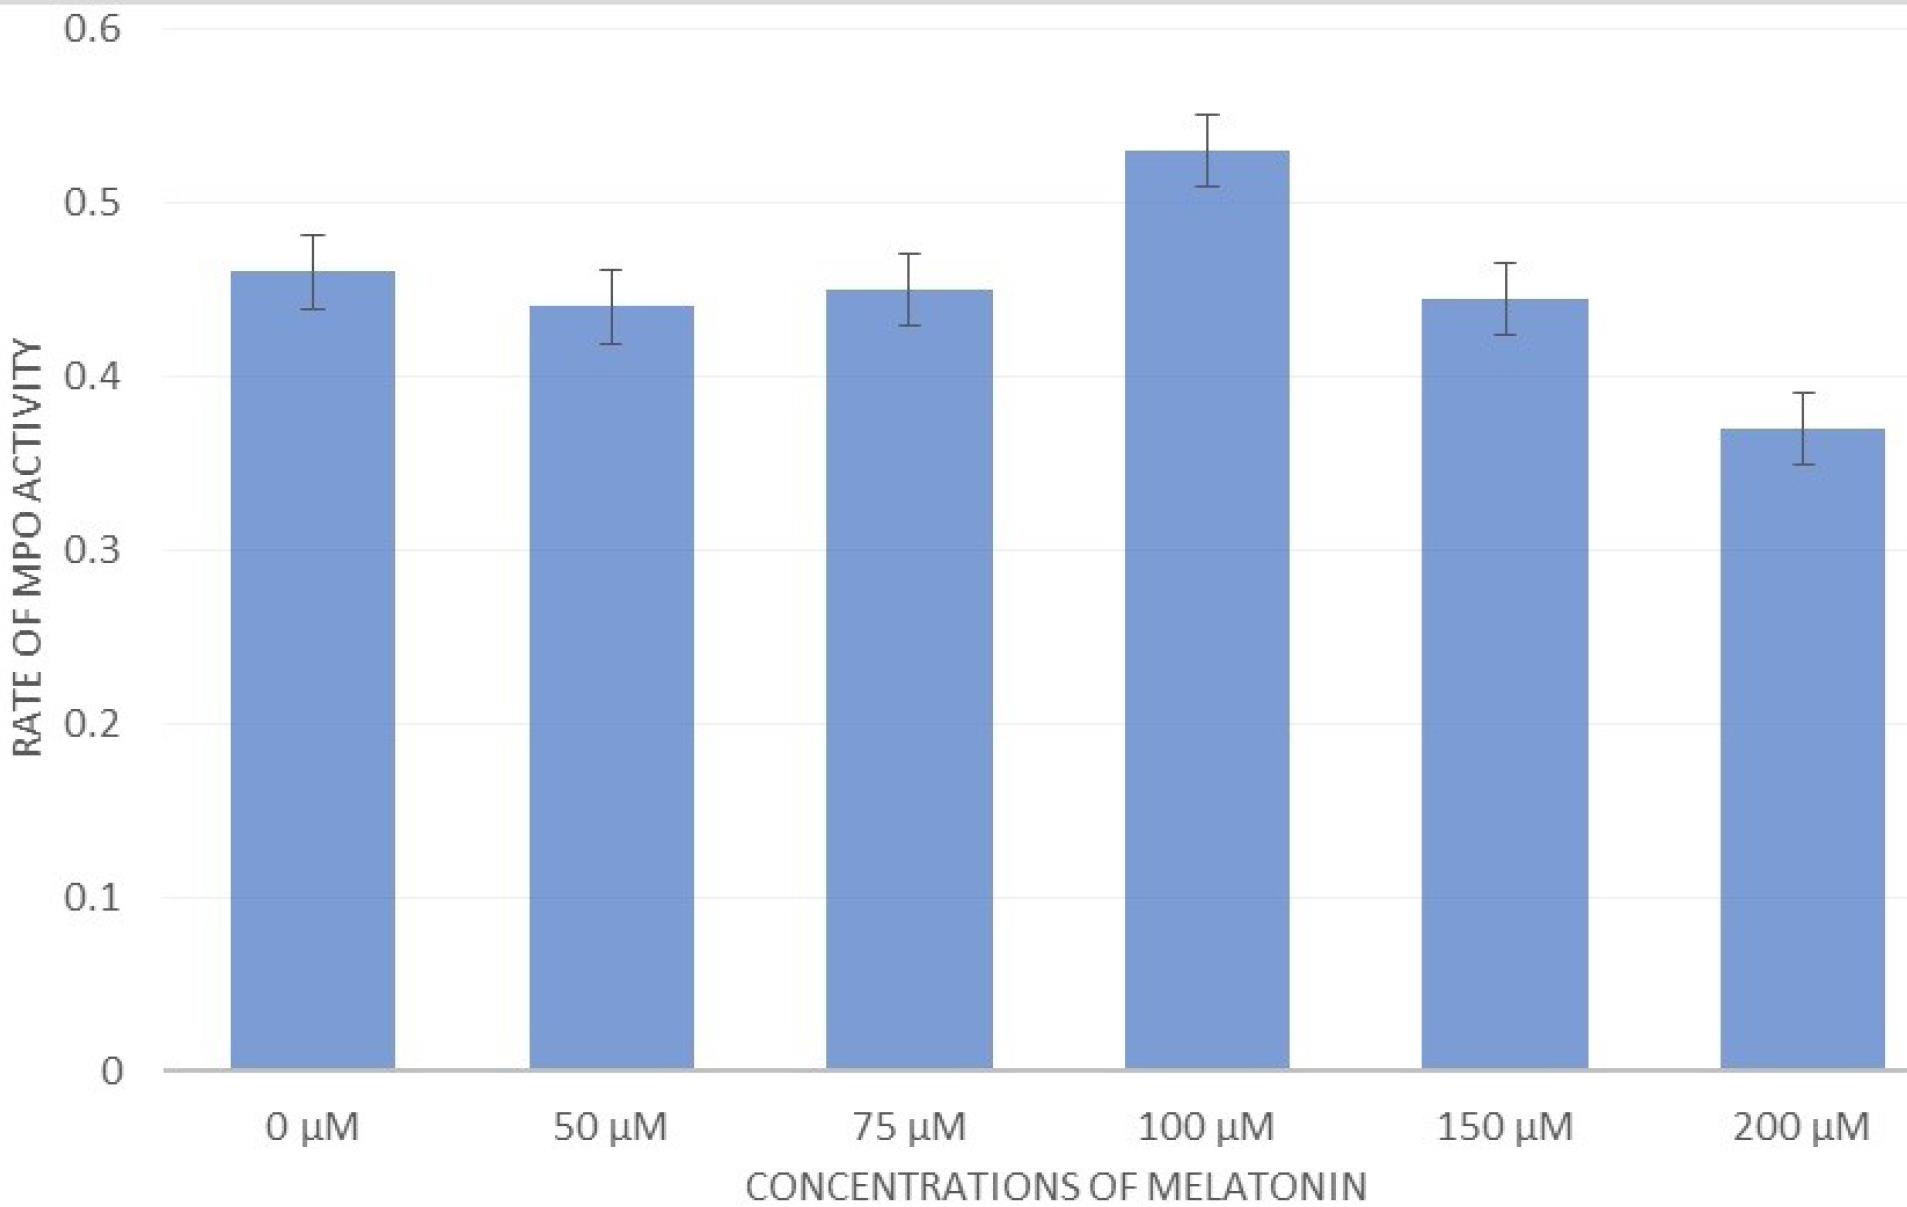
Figure 7.
The Effect of Different Concentrations of Melatonin on MPO Activity. Note. MPO: Myeloperoxidase. Melatonin at a concentration of 100 μM could increase the MPO activity of the supernatant of RAW macrophage cells. However, at higher concentrations (e.g., 150 μM and 200 μM), it reduced this amount
.
The Effect of Different Concentrations of Melatonin on MPO Activity. Note. MPO: Myeloperoxidase. Melatonin at a concentration of 100 μM could increase the MPO activity of the supernatant of RAW macrophage cells. However, at higher concentrations (e.g., 150 μM and 200 μM), it reduced this amount
Measurement of the Production of Nitric Oxide in the Supernatant of RAW264.7 Cells by the Grease Method
The amount of NO production in the RAW group was measured in the supernatant of the cells. The results confirmed that the amount of NO production in the RAW cell line exposed to different concentrations of MLT was lower than in the control group, but it was not significant (Figure 8).
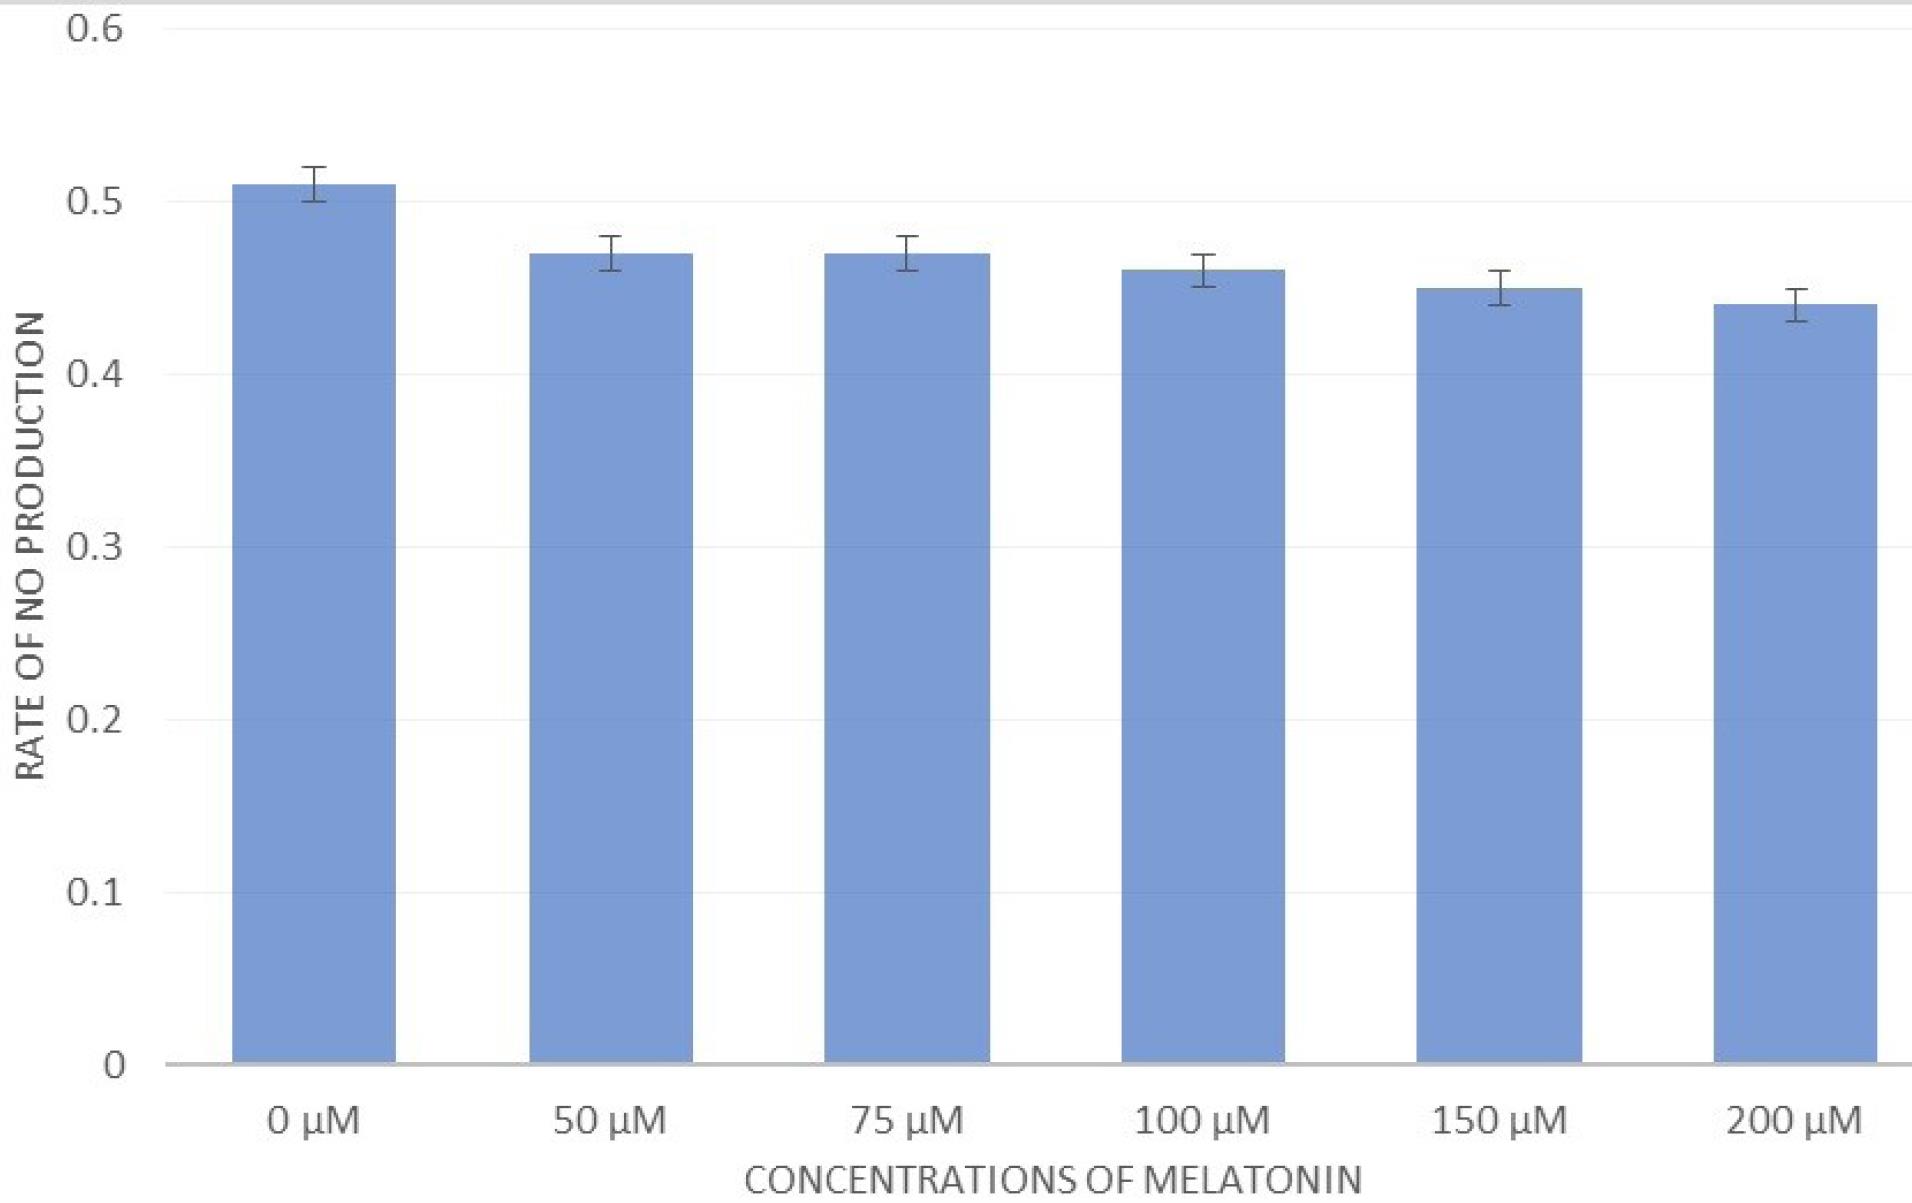
Figure 8.
The Effect of Different Concentrations of Melatonin on NO Production. Note. NO: Nitric oxide. Melatonin could inhibit the production of NO from the supernatant of RAW macrophage cells, but not significantly
.
The Effect of Different Concentrations of Melatonin on NO Production. Note. NO: Nitric oxide. Melatonin could inhibit the production of NO from the supernatant of RAW macrophage cells, but not significantly
Discussion
Despite recent advances in disease diagnosis and treatment, cancer is one of the most important causes of death in the world, and skin cancer is one of the most common cancers. Melanoma is one of these malignant skin cancers, which is the most invasive and deadly type of skin cancer, and its prevalence increases gradually.2 Due to challenges in the treatment of melanoma and the need to use new treatments for this disease over the past years, MLT has been considered an effective substance in the treatment of melanoma. MLT is a hormone secreted by the pineal gland that is involved in regulating circadian and seasonal rhythms5; of course, this hormone has different effects on the endocrine, neural, and immune systems.6 According to the positive effects of MLT in melanoma treatment in recent studies, this study evaluated the effects of this hormone on the A-375 human melanoma cell line.
Various studies have investigated the inhibitory effects of MLT on several cell lines of human melanoma. For example, it inhibits the in-vitro proliferation of the M-6 human melanoma cell line26 and, at certain concentrations, suppresses the proliferation of all 4 melanoma cell lines (SBCE2, WM-98, WM-164, and SKMEL-188). In another study, it was shown that MLT reduces the growth of SK-ML-1 human melanoma cells.27 The results of our study are also consistent with those of these studies. In our study, when A-385 cells were exposed to MLT at concentrations of 0 μM, 50 μM, 75 μM, 100 μM, 150 μM, and 200 μM for 24 hours, the growth of malignant cells was inhibited in a dose-dependent manner, so that maximum inhibition was at 200 μM concentrations (Figure 3 and 5).
Ina study conducted on male and female athymic mice that have been inoculated with a large number of melanoma cells and MLT (5 μg/g body weight/day) was orally administered (plus 0.5% ethanol), the size of their tumors was significantly decreased after 40 days. The size of the testes, ovaries, and adrenal glands was decreased as well. Therefore, it has been shown that oral MLT intake significantly inhibits melanoma growth and reduces the size of gonads and adrenals.21 Alvarez et al, investigating the effects of MLT on the melanoma B16-F10 cell line in murine, both in cell culture and in vivo models, found that the antiproliferative effect of MLT reduced the growth rate and migration ability of malignant cells.22 In another study, it was reported that MLT inhibits the growth of rodent melanoma cells at low concentrations (0.1–10 nM), but it has no effects on melanogenesis. However, at high concentrations ( ≥ 0.1 μM), it prevents melanogenesis induction but does not affect cell growth23. Furthermore, MLT significantly inhibits both PG19 and B16BL6 mouse melanoma cell lines at its physiological concentrations (10 μM to 0.1 pM).24
In a study, it was revealed that MLT could inhibit the growth of melanoma and breast cancer cells in a dose- and time-dependent manner.25 Ying investigated the potential oncostatic properties of MLT and its binding characteristics and functional effects on the M-6 melanoma cell line. They demonstrated that the in-vitro proliferation of M-6 cells was significantly inhibited by MLT, its analogs 6-chloromelatonin, and 2-iodomelatonin (at concentrations ranging from 10(-9) to 10(-4) M).26 In another study, evaluating the effects of MLT on 4 melanoma cell lines (SBCE2, WM-98, WM-164, and SKMEL-188) at different concentrations, it was found that MLT suppressed the proliferation of all cell lines at pharmacological concentrations (10-3-10-7 M).27 Cabrera et al reported that MLT reduced the growth of the SK-MEL-1 human melanoma cell line. The antiproliferative effect was associated with changes in the progression of the cell cycle phases and an increase in the activity of the main melanogenesis regulatory enzyme, tyrosinase.28
Several studies have shown that macrophages do not only phagocytosis or clearance of dead cells, but in the melanoma microenvironment, they are involved in all stages of melanogenesis. In the early stages of cancer, macrophages form an inflammatory microenvironment and then suppress the anti-cancer activity of the immune system, stimulating angiogenesis, enhancing the migration ability of malignant cells, and finally participating in the process of metastasis.29 According to the benefits of macrophages to melanoma, understanding signal pathways and involved proteins can help target therapy against disseminated melanoma.30
As mentioned, MLT has positive effects on melanoma. Among the immune system elements are macrophages, which are not excluded from these effects. For example, MLT helps spleen macrophages to antigen presentation to T-cells in mice,31 and testicular macrophages enhance the capacity of phagocytosis in mice by increasing the free intracellular Ca level.32 Moreover, in a type of mouse, increasing the levels of MLT in the blood circulating at night is associated with increases in the phagocytic activity of peritoneal macrophages.33,34 Nonetheless, it has been shown that the effects of MLT on macrophages are negative. MLT inhibits the expression of various genes in RAW264.7 macrophages treated with LPS, including IL-1β and IL-6.35 In this study, RAW macrophages are used, which are monocyte/macrophage-like cell lines that have been commonly utilized in studies for more than 40 years. These cell lines can perform pinocytosis and phagocytosis, and they increase the production of NO and phagocytosis by stimulating LPSs. Additionally, they can kill the target cells through antibody-dependent toxicity.36-38 Therefore, in our study, the A-375 melanoma cell line was exposed to MLT-treated RAW macrophages.
Our study investigated the effects of MLT-treated RAW macrophages on the A-375 melanoma cell line. After treatment of RAW macrophages with MLT for 24 hours at concentrations of 0 μM, 50 μM, 75 μM, 100 μM, 150 μM, and 200 μM, they were placed in the vicinity of A-375 cells. It was shown that, at low concentrations (50 μM and 75 μM), MLT increased the proliferation of RAW264.7 cells and thus the density of A-375 cells. However, at higher concentrations of MLT (150 μM and 200 µM), in which the growth and proliferation of macrophages were inhibited by MLT, the growth of malignant cells was inhibited as well (Figure 6).
A number of studies on the effects of MLT on macrophages have reported that this effect is inhibitory. MLT inhibits the production of NO in bacterial LPS-stimulated macrophages by inhibiting the expression of the inducible isoform of NO synthase.39,40 Another study showed that MLT in LPS-treated RAW264.7 macrophages could inhibit the expression of various genes, such as IL-1β and IL-6.36 In this study, RAW264.7 macrophages were treated at concentrations of 0 μM, 50 μM, 75 μM, 100 μM, 150 μM, and 200 μM MLT for 24 hours, and the results revealed that low concentrations of MLT increased the growth and differentiation of RAW264.7 cells, but with increasing the concentration, their growth and differentiation were inhibited, so that the maximum inhibition was obtained at 200 μM (Figure 2 and 4). Additionally, our results demonstrated that MLT reduced the production of NO from the supernatant of RAW264.7 cells at concentrations of 50 μM to 200 μM. Nonetheless, this reduction was not significant (Figure 8), which is consistent with the findings of the above studies.
As mentioned, MPO had a key role in the innate immune response.38 Galijasevicet al concluded that MLT inhibits the MPO in different ways (e.g., by changing the peroxidation to catalase-like activity and converting it to inactive form).41 MLT reduces the MPO activity in blood vessels by limiting hydrogen peroxide (a co-substrate of MPO) and reducing the vascular wall infiltration of the MPO-secreting leukocytes.38 Our study results are also in line with the findings of these studies, so that the MPO activity was reduced at concentrations of 0 μM to 200 μM of MLT. The activity of MPO increased surprisingly at a concentration of 100 μM (Figure 7).
Conclusion
Our findings revealed that, at concentrations of 150 μM and 200 μM, MLT inhibited the growth of A-375 cells by inhibiting the growth and differentiation of RAW264.7 cells. Therefore, it can be used to treat melanoma at the mentioned concentrations.
Acknowledgements
We would like to thank the academic members and staff of the Department of Immunology, Tabriz University of Medical Sciences, Tabriz, Iran.
Authors’ Contribution
Conceptualization: Mojtaba Golinezhad.
Data curation: Ilgar Amjadi.
Formal analysis: Bahareh Sartipi.
Funding acquisition: Bahareh Sartipi.
Investigation: Ilgar Amjadi.
Methodology: Bahareh Sartipi.
Project administration: Mojtaba Golinezhad.
Resources: Bahareh Sartipi.
Software: Bahareh Sartipi.
Supervision: Mojtaba Golinezhad.
Validation: Mojtaba Golinezhad.
Visualization: Bahareh Sartipi.
Writing–original draft: Ilgar Amjadi.
Writing–review & editing: Mojtaba Golinezhad.
Competing Interests
None.
Ethical Approval
This study was funded by Tabriz University of Medical Sciences ethical comitee IR.TBZMED.VCR.REC.1400.342.
References
- Jemal A, Siegel R, Ward E, Hao Y, Xu J, Thun MJ. Cancer statistics, 2009. CA Cancer J Clin 2009; 59(4):225-49. doi: 10.3322/caac.20006 [Crossref] [ Google Scholar]
- Gonzalez R, Sanchez A, Ferguson JA, Balmer C, Daniel C, Cohn A. Melatonin therapy of advanced human malignant melanoma. Melanoma Res 1991; 1(4):237-43. doi: 10.1097/00008390-199111000-00003 [Crossref] [ Google Scholar]
- Newton Bishop JA. Lentigos, melanocytic naevi and melanoma. In: Burns T, Breathnach S, Cox N, Griffiths C, eds. Rook’s Textbook of Dermatology. Vol 1. John Wiley & Sons; 2010. p. 1-57. 10.1002/9781444317633.ch54.
- Domingues B, Lopes JM, Soares P, Pópulo H. Melanoma treatment in review. Immunotargets Ther 2018; 7:35-49. doi: 10.2147/itt.s134842 [Crossref] [ Google Scholar]
- Reiter RJ. The melatonin rhythm: both a clock and a calendar. Experientia 1993; 49(8):654-64. doi: 10.1007/bf01923947 [Crossref] [ Google Scholar]
- Hardeland R, Pandi-Perumal SR, Cardinali DP. Melatonin. Int J Biochem Cell Biol 2006; 38(3):313-6. doi: 10.1016/j.biocel.2005.08.020 [Crossref] [ Google Scholar]
- Haus E, Lakatua DJ, Swoyer J, Sackett-Lundeen L. Chronobiology in hematology and immunology. Am J Anat 1983; 168(4):467-517. doi: 10.1002/aja.1001680406 [Crossref] [ Google Scholar]
- Paglieroni TG, Holland PV. Circannual variation in lymphocyte subsets, revisited. Transfusion 1994; 34(6):512-6. doi: 10.1046/j.1537-2995.1994.34694295067.x [Crossref] [ Google Scholar]
- Fernandes G, Carandente F, Halberg E, Halberg F, Good RA. Circadian rhythm in activity of lympholytic natural killer cells from spleens of Fischer rats. J Immunol 1979; 123(2):622-5. [ Google Scholar]
- Petrovsky N, Harrison LC. Diurnal rhythmicity of human cytokine production: a dynamic disequilibrium in T helper cell type 1/T helper cell type 2 balance?. J Immunol 1997; 158(11):5163-8. [ Google Scholar]
- Blom JM, Gerber JM, Nelson RJ. Day length affects immune cell numbers in deer mice: interactions with age, sex, and prenatal photoperiod. Am J Physiol 1994; 267(2 Pt 2):R596-601. doi: 10.1152/ajpregu.1994.267.2.R596 [Crossref] [ Google Scholar]
- Demas GE, Nelson RJ. Short-day enhancement of immune function is independent of steroid hormones in deer mice (Peromyscus maniculatus). J Comp Physiol B 1998; 168(6):419-26. doi: 10.1007/s003600050161 [Crossref] [ Google Scholar]
- Haldar C, Singh R, Guchhait P. Relationship between the annual rhythms in melatonin and immune system status in the tropical palm squirrel, Funambulus pennanti. Chronobiol Int 2001; 18(1):61-9. doi: 10.1081/cbi-100001174 [Crossref] [ Google Scholar]
- Deprés-Brummer P, Bourin P, Pages N, Metzger G, Lévi F. Persistent T lymphocyte rhythms despite suppressed circadian clock outputs in rats. Am J Physiol 1997; 273(6):R1891-9. doi: 10.1152/ajpregu.1997.273.6.R1891 [Crossref] [ Google Scholar]
- Vaughan MK, Reiter RJ. Transient hypertrophy of the ventral prostate and coagulating glands and accelerated thymic involution following pinealectomy in the mouse. Tex Rep Biol Med 1971; 29(4):579-86. [ Google Scholar]
- McKinney TD, Vaughan MK, Reiter RJ. Pineal influence on intermale aggression in adult house mice. Physiol Behav 1975; 15(2):213-6. doi: 10.1016/0031-9384(75)90238-3 [Crossref] [ Google Scholar]
- Maestroni GJ, Conti A, Pierpaoli W. Role of the pineal gland in immunity Circadian synthesis and release of melatonin modulates the antibody response and antagonizes the immunosuppressive effect of corticosterone. J Neuroimmunol 1986; 13(1):19-30. doi: 10.1016/0165-5728(86)90047-0 [Crossref] [ Google Scholar]
- Vaughan MK, Vaughan GM, Reiter RJ, Blask DE. Influence of melatonin, constant light, or blinding on reproductive system of gerbils (Merionesunguiculatus). Experientia 1976; 32(10):1341-2. doi: 10.1007/bf01953128 [Crossref] [ Google Scholar]
- Vaughan MK, Hubbard GB, Champney TH, Vaughan GM, Little JC, Reiter RJ. Splenic hypertrophy and extramedullary hematopoiesis induced in male Syrian hamsters by short photoperiod or melatonin injections and reversed by melatonin pellets or pinealectomy. Am J Anat 1987; 179(2):131-6. doi: 10.1002/aja.1001790205 [Crossref] [ Google Scholar]
- Guerrero JM, Reiter RJ. Melatonin-immune system relationships. Curr Top Med Chem 2002; 2(2):167-79. doi: 10.2174/1568026023394335 [Crossref] [ Google Scholar]
- Narita T, Kudo H. Effect of melatonin on B16 melanoma growth in athymic mice. Cancer Res 1985; 45(9):4175-7. [ Google Scholar]
- Alvarez-Artime A, Cernuda-Cernuda R, Francisco Artime N, Cepas V, Gonzalez-Menendez P, Fernadez-Vega S. Melatonin-induced cytoskeleton reorganization leads to inhibition of melanoma cancer cell proliferation. Int J Mol Sci 2020; 21(2):548. doi: 10.3390/ijms21020548 [Crossref] [ Google Scholar]
- Slominski A, Pruski D. Melatonin inhibits proliferation and melanogenesis in rodent melanoma cells. Exp Cell Res 1993; 206(2):189-94. doi: 10.1006/excr.1993.1137 [Crossref] [ Google Scholar]
- Cos S, Garcia-Bolado A, Sánchez-Barceló EJ. Direct antiproliferative effects of melatonin on two metastatic cell sublines of mouse melanoma (B16BL6 and PG19). Melanoma Res 2001; 11(2):197-201. doi: 10.1097/00008390-200104000-00016 [Crossref] [ Google Scholar]
- Gatti G, Lucini V, Dugnani S, Calastretti A, Spadoni G, Bedini A. Antiproliferative and pro-apoptotic activity of melatonin analogues on melanoma and breast cancer cells. Oncotarget 2017; 8(40):68338-53. doi: 10.18632/oncotarget.20124 [Crossref] [ Google Scholar]
- Ying SW, Niles LP, Crocker C. Human malignant melanoma cells express high-affinity receptors for melatonin: antiproliferative effects of melatonin and 6-chloromelatonin. Eur J Pharmacol 1993; 246(2):89-96. doi: 10.1016/0922-4106(93)90084-m [Crossref] [ Google Scholar]
- Fischer TW, Zmijewski MA, Zbytek B, Sweatman TW, Slominski RM, Wortsman J. Oncostatic effects of the indole melatonin and expression of its cytosolic and nuclear receptors in cultured human melanoma cell lines. Int J Oncol 2006; 29(3):665-72. doi: 10.3892/ijo.29.3.665 [Crossref] [ Google Scholar]
- Cabrera J, Negrín G, Estévez F, Loro J, Reiter RJ, Quintana J. Melatonin decreases cell proliferation and induces melanogenesis in human melanoma SK-MEL-1 cells. J Pineal Res 2010; 49(1):45-54. doi: 10.1111/j.1600-079X.2010.00765.x [Crossref] [ Google Scholar]
- Pieniazek M, Matkowski R, Donizy P. Macrophages in skin melanoma-the key element in melanomagenesis. Oncol Lett 2018; 15(4):5399-404. doi: 10.3892/ol.2018.8021 [Crossref] [ Google Scholar]
- Klimp AH, de Vries EG, Scherphof GL, Daemen T. A potential role of macrophage activation in the treatment of cancer. Crit Rev Oncol Hematol 2002; 44(2):143-61. doi: 10.1016/s1040-8428(01)00203-7 [Crossref] [ Google Scholar]
- Pioli C, Caroleo MC, Nistico G, Doria G. Melatonin increases antigen presentation and amplifies specific and non-specific signals for T-cell proliferation. Int J Immunopharmacol 1993; 15(4):463-8. doi: 10.1016/0192-0561(93)90060-c [Crossref] [ Google Scholar]
- Pawlak J, Singh J, Lea RW, Skwarlo-Sonta K. Effect of melatonin on phagocytic activity and intracellular free calcium concentration in testicular macrophages from normal and streptozotocin-induced diabetic rats. Mol Cell Biochem 2005; 275(1-2):207-13. doi: 10.1007/s11010-005-1995-6 [Crossref] [ Google Scholar]
- Sanchez S, Paredes SD, Sanchez CL, Barriga C, Reiter RJ, Rodriguez AB. Tryptophan administration in rats enhances phagocytic function and reduces oxidative metabolism. Neuro Endocrinol Lett 2008; 29(6):1026-32. [ Google Scholar]
- Esteban S, Nicolaus C, Garmundi A, Rial RV, Rodríguez AB, Ortega E. Effect of orally administered L-tryptophan on serotonin, melatonin, and the innate immune response in the rat. Mol Cell Biochem 2004; 267(1-2):39-46. doi: 10.1023/b:mcbi.0000049363.97713.74 [Crossref] [ Google Scholar]
- Kadena M, Kumagai Y, Vandenbon A, Matsushima H, Fukamachi H, Maruta N. Microarray and gene co-expression analysis reveals that melatonin attenuates immune responses and modulates actin rearrangement in macrophages. Biochem Biophys Res Commun 2017; 485(2):414-20. doi: 10.1016/j.bbrc.2017.02.063 [Crossref] [ Google Scholar]
- Taciak B, Białasek M, Braniewska A, Sas Z, Sawicka P, Kiraga Ł. Evaluation of phenotypic and functional stability of RAW 2647 cell line through serial passages. PLoS One 2018; 13(6):e0198943. doi: 10.1371/journal.pone.0198943 [Crossref] [ Google Scholar]
- Ban JY, Kim BS, Kim SC, Kim DH, Chung JH. Microarray analysis of gene expression profiles in response to treatment with melatonin in lipopolysaccharide activated RAW 2647 cells. Korean J Physiol Pharmacol 2011; 15(1):23-9. doi: 10.4196/kjpp.2011.15.1.23 [Crossref] [ Google Scholar]
- van der Zwan LP, Scheffer PG, Teerlink T. Reduction of myeloperoxidase activity by melatonin and pycnogenol may contribute to their blood pressure lowering effect. Hypertension 2010; 56(3):e34. doi: 10.1161/hypertensionaha.110.158170 [Crossref] [ Google Scholar]
- Gilad E, Wong HR, Zingarelli B, Virág L, O’Connor M, Salzman AL. Melatonin inhibits expression of the inducible isoform of nitric oxide synthase in murine macrophages: role of inhibition of NFkappaB activation. FASEB J 1998; 12(9):685-93. doi: 10.1096/fasebj.12.9.685 [Crossref] [ Google Scholar]
- Zhang S, Li W, Gao Q, Wei T. Effect of melatonin on the generation of nitric oxide in murine macrophages. Eur J Pharmacol 2004; 501(1-3):25-30. doi: 10.1016/j.ejphar.2004.08.015 [Crossref] [ Google Scholar]
- Galijasevic S, Abdulhamid I, Abu-Soud HM. Melatonin is a potent inhibitor for myeloperoxidase. Biochemistry 2008; 47(8):2668-77. doi: 10.1021/bi702016q [Crossref] [ Google Scholar]